
The digital shadows teem with malicious code, and the frontline of defense often requires us to stare into the abyss. In the realm of reverse engineering, IDA Pro stands as a formidable fortress, a tool that can dissect the most complex threats. This isn't about admiring the architecture of an attack; it's about understanding its anatomy to build stronger walls. Today, we're opening the black box, not to celebrate the breach, but to learn from the scars.
Our journey will focus on the practical application of IDA Pro for malware analysis, transforming raw code into actionable intelligence. While the tools of the offensive are often discussed, our objective here is singular: to empower the defender. We dissect these techniques to understand the adversary's playbook, enabling us to anticipate, detect, and neutralize threats before they inflict damage.
The Intelligence Brief: Unpacking Malware with IDA Pro
The cybersecurity landscape is a constant arms race. Attackers evolve their tactics, obfuscate their code, and exploit human and system vulnerabilities. To stand on the cutting edge of defense, we must possess the analytical capabilities to unravel their creations. IDA Pro, a veteran in the reverse engineering arena, offers a powerful environment for this critical task. This isn't about replicating an attack; it's about reverse-engineering the threat to illuminate its weaknesses and, by extension, fortify our own digital perimeters.
This guide, inspired by the granular insights found in resources like OALABS, focuses on practical techniques to analyze malware. We'll navigate the complexities of PE files, dynamic API resolution, memory snapshots, and debugger techniques. Each step is a building block for a more robust defensive posture.
Understanding the Battlefield: PE File Fundamentals
Before diving into IDA Pro, a foundational understanding of the Portable Executable (PE) file format is essential. This is the blueprint of most Windows executables, DLLs, and drivers. Knowing how a PE file is structured—its headers, sections, and import/export tables—is crucial for understanding how malware operates and how it's loaded into memory.
"The PE format is the gateway. If you don't understand its mapping in memory, its virtual addresses versus its raw offsets, you're flying blind. It's the first layer of obfuscation attackers rely on."
Key concepts include:
- PE Mapped Virtual Address vs. Offset In Binary File: Understanding the difference between where a section resides in memory when the program runs versus its physical location on disk. This is vital for memory forensics and unpacking techniques. (Approximately 02:55 in practical demonstrations).
- PE Basics including how a PE is mapped in memory: Resources like here and here provide the groundwork for this critical knowledge.
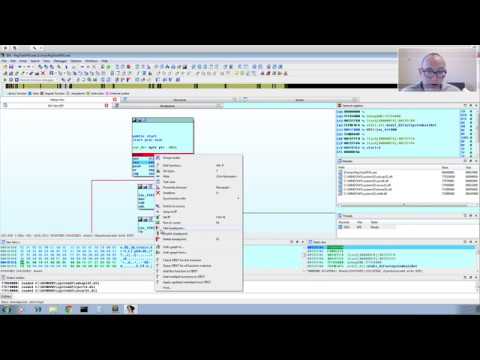
Configuring Your Analysis Environment: IDA Pro Layout and Setup
IDA Pro's default interface can be overwhelming. Optimizing your layout is the first step towards efficient analysis. Familiarize yourself with the disassembly view, hex view, and output window. Customizing these to your workflow can significantly speed up your investigations.
IDA Pro Layout Tips: (05:10) Focus on arranging windows for optimal viewing of disassembly, cross-references, and function calls. A clean, logical workspace reduces cognitive load and allows you to focus on the code.
IDA Pro Remote Debugger Setup and Use: (09:06) For dynamic analysis, setting up the remote debugger is paramount. This allows you to control the execution of your target binary and inspect its state in real-time. Debugging DLLs presents its own set of challenges, often requiring specific setup procedures. (01:16:32)
Unraveling the Execution Flow: Dynamic Analysis Techniques
Static analysis in IDA Pro gives us a static snapshot of the code. Dynamic analysis, however, allows us to observe the malware in action, revealing its true behavior. This is where we see the code come alive and interact with the system.
Resolving APIs and Tracing Execution
Malware often relies on legitimate Windows APIs to perform malicious actions. Understanding how these APIs are called and what arguments they receive is key to understanding the malware's intent.
- Dynamically Resolving APIs: (08:10) Many packed or obfuscated binaries don't have their API imports statically resolved. Learning to resolve these dynamically during runtime is a critical skill for unpacking. Libraries like
DynamoRIOor built-in IDA Pro debugger features can assist here. - Walking Call Chain From Hooked API Back To Malware: (22:59) When an API is hooked (e.g., by a debugger or anti-analysis technique), tracing the call stack backward can lead you to the malicious code that initiated the sequence. This helps pinpoint the origin of suspicious activity.
Memory Snapshots for Unpacking
One of the most effective techniques for dealing with packed malware is using memory snapshots. Once the malware unpacks itself in memory, you can dump that unpacked state and analyze it. This bypasses many static obfuscation techniques.
- Using Memory Snapshots To Unpack Malware (Quick Unpacking): (40:07) This method involves pausing the malicious process after it has unpacked itself in memory and dumping the process memory. This dumped memory can then be loaded back into IDA Pro for analysis, revealing the original, unpacked code.
Interacting with the Stack and API Arguments
The stack is fundamental to function calls. Understanding how arguments are passed and how you can manipulate them during debugging can be incredibly powerful for analysis and even for certain defense bypass maneuvers (though our focus remains on observation and defense).
- Win32 API Calls and The Stack (How To Change Arguments On The Fly): (46:28) During a debugging session, you can often alter API arguments in memory. This allows you to test hypotheses, such as what would happen if a file path was different, or if a network connection was prevented.
Arsenal of the Analyst
To effectively engage in malware analysis with IDA Pro, a well-equipped arsenal is indispensable. The tools and knowledge base you cultivate will define your proficiency and your ability to defend.
- IDA Pro Book: For an authoritative deep dive, the book here is an excellent resource.
- Microsoft Calling Conventions: Understanding these is crucial for correctly interpreting function arguments and return values. Consult this resource.
- Unpac.me: A valuable service for automatically unpacking malware, providing a clean sample for further analysis. (Try the Automated Malware Unpacking service).
- Demo Binaries: For safe practice, use benign samples like
RegTestUPX1.exe(safe to run). - Cautionary Sample: The
final_unmapped.dllis a sample of real malware. **WARNING: REAL MALWARE, ONLY RUN IN A VM.** (Link provided in original context, exercise extreme caution). - OALABS Resources: Explore their Discord, Patreon, Tip Jar, and GitHub for more insights.
Veredicto del Ingeniero: IDA Pro for Defensive Intelligence
IDA Pro is not merely a disassembler; it is an intelligence platform. For defenders, mastering IDA Pro is akin to equipping yourself with a high-powered microscope capable of dissecting threats at their most fundamental level. Its power lies in its meticulous detail and the control it offers over binary analysis. While it has a steep learning curve, the insights gained are invaluable for threat hunting, incident response, and vulnerability research.
Pros: Unparalleled static analysis capabilities, extensive support for various architectures and file formats, powerful debugging features, a vast ecosystem of plugins and scripts.
Cons: Commercial license can be expensive, requires significant expertise to leverage fully, dynamic analysis capabilities are robust but sometimes require external tooling.
For any security professional serious about understanding the "how" and "why" behind malicious software, IDA Pro remains a non-negotiable tool. It transforms educated guesses into definitive conclusions.
Taller Defensivo: Detecting Suspicious API Calls
As defenders, one of our primary goals is to detect malicious activity. A common indicator is the abnormal use of system APIs. Let's outline a process for identifying suspicious API call patterns within IDA Pro.
- Load the Sample: Open the potentially malicious binary in IDA Pro.
- Analyze Import Table: Navigate to "Imports" to see the list of external functions the binary intends to use. Pay attention to sensitive APIs like
CreateProcess,WriteProcessMemory,RegSetValueEx,URLDownloadToFile, etc. - Cross-Referencing: For each suspicious API identified, right-click on it and select "Jump to xref to operand" (or similar option depending on your IDA Pro version). This will show you all the places in the code where this API is called.
- Analyze Callers: Examine the code segments that call these APIs. Look for unusual patterns:
- APIs being called with unexpected arguments.
- APIs being called in a sequence that suggests malicious intent (e.g., downloading a file, then executing it).
- APIs being called from unfamiliar or obfuscated code blocks.
- Dynamic Analysis (Optional but Recommended): Use IDA Pro's debugger or a separate dynamic analysis tool (like x64dbg, or even a sandbox environment) to observe these API calls in action. Monitor the arguments passed and the return values.
- Develop Signatures/Rules: Based on your analysis, you can start developing indicators of compromise (IoCs) or detection rules for your security tools (e.g., SIEM, EDR). This could be a specific sequence of API calls, or the use of a particular API with known malicious arguments.
Preguntas Frecuentes
What is the primary advantage of using IDA Pro for malware analysis?
IDA Pro's strength lies in its comprehensive static analysis capabilities, allowing deep inspection of code before execution. It provides unparalleled control and visibility into the program's structure and logic.
How does dynamic analysis complement static analysis in IDA Pro?
Dynamic analysis, often performed with IDA Pro's debugger, reveals the runtime behavior of malware. It helps resolve dynamically loaded APIs, track execution flow, and understand how obfuscation is bypassed in memory, providing a more complete picture than static analysis alone.
Is IDA Pro suitable for analyzing packed or obfuscated malware?
Yes, IDA Pro is exceptionally suited for this. Techniques like memory snapshots and dynamic debugging allow analysts to unpack malware in memory and then analyze the clean code, bypassing many obfuscation layers.
El Contrato: Fortalecer tu Laboratorio de Análisis
You've seen the power within IDA Pro to deconstruct threats. Now, put that knowledge into action. Your challenge is to set up a safe, isolated analysis environment and perform a basic API hook and analysis on a benign executable (like RegTestUPX1.exe, if you can find a safe version or a similar UPX-packed benign executable).
Your goal: demonstrate the ability to set up IDA Pro's debugger, identify API calls, and trace their usage. Document the steps you took and any interesting observations about how the benign program uses its imported functions. This practical exercise is the first step in building a robust defense against the unknown.