Showing posts with label elastic stack. Show all posts

The Unseen Battlefield: Mastering Network Detection & Incident Response with Open-Source Arsenal

The hum of servers, the whisper of data packets, the silent ballet of network traffic – this is where the real war is fought. Firewalls and EDRs are the first lines of defense, the visible bulwark. But when the walls are breached, when the ghosts in the machine surface, true visibility lies in the captured streams, the unvarnished transit of information. This is the realm of Network Detection and Incident Response (NDIR), and its most potent weapons are forged in the crucible of open source. Forget the proprietary black boxes that drain your budget; the real power lies in community-driven intelligence and tools that cut to the bone.

In the shadowed alleys of cybersecurity, incident responders are detectives, not just system administrators. We sift through digital detritus, reconstructing events piece by painstaking piece. The traditional tooling, while necessary, often paints an incomplete picture. EDRs react, firewalls block, but the network itself? It remembers everything. It’s the ultimate black box recorder, a tapestry of evidence woven from every connection, every transaction. To truly understand a breach, you must dive into this tapestry. And for that dive, nothing beats the raw, unadulterated power of open-source solutions. These aren't just tools; they're extensions of a global consciousness, a distributed intelligence network that can be your greatest ally.

The Open Source Advantage: More Than Just Free

The allure of open-source security tools isn't merely their lack of licensing fees. It's about transparency, customization, and the sheer velocity of innovation driven by a global community. When a zero-day exploit hits, proprietary solutions often lag, waiting for vendor patches. Open-source communities? They swarm. Intel is shared in real-time, detections are refined collectively, and the tools themselves evolve at a pace that outstrips corporate roadmaps. This isn't charity; it's survival. A shared fight against a common enemy, powered by shared tools.

Core Pillars of Open-Source NDIR

When we talk about building a robust NDIR capability with open-source, a few names consistently surface, each offering a unique lens on network activity:

  • Zeek (formerly Bro): This isn't just a network sniffer; it's a powerful network analysis framework. Zeek interprets network traffic, providing rich, high-level logs of network activity – from HTTP requests and DNS queries to SSL certificates and file transfers. It transforms raw packet data into structured, actionable logs that are invaluable for threat hunting and forensic analysis. Think of it as the intelligence analyst dissecting communication patterns.
  • Suricata: A high-performance Network Intrusion Detection System (NIDS), Intrusion Prevention System (NIPS), and Network Security Monitoring (NSM) engine. Suricata excels at real-time threat detection using sophisticated rule sets. It can identify malicious traffic signatures, protocol anomalies, and even exploit attempts, acting as the frontline sentinel against known and emerging threats.
  • Elastic Stack (Elasticsearch, Logstash, Kibana): While not strictly a network tool, the Elastic Stack is the indispensable command center. Elasticsearch provides powerful search and analytics capabilities for the vast amounts of data generated by Zeek and Suricata. Logstash ingests and transforms this data, and Kibana offers a visually intuitive dashboard for exploration, visualization, and alerting. It's where raw evidence becomes a coherent narrative.

Real-Life Exploitation: Use Cases from the Trenches

These tools aren't academic exercises; they are battle-tested. Consider these scenarios:

  • Detecting Lateral Movement: An attacker gains a foothold on a single machine. EDR might flag the initial compromise, but how do you track their movements across the network? Zeek logs can reveal unusual internal DNS lookups, SMB connections to suspicious hosts, or unexpected RDP sessions. Suricata can alert on crafted packets attempting to exploit vulnerabilities on other internal systems. Kibana visualizes these connections, highlighting the attacker's path.
  • Identifying C2 Communications: Malicious actors often use Command and Control (C2) channels to manage compromised systems. Zeek's HTTP logs can expose connections to known malicious domains or unusual user agents. Its DNS logs can reveal communication with newly registered or suspicious domains. Suricata rulesets can directly detect patterns indicative of specific C2 frameworks.
  • Forensic Analysis of Malware: When malware is detonated, it rarely operates in silence. Zeek can log DNS queries made by the malware, the files it attempts to download or exfiltrate, and the connections it establishes. By analyzing these logs in Kibana, investigators can reconstruct the malware's behavior, identify its command infrastructure, and understand its objectives.
  • Responding to Zero-Days: While signature-based systems like Suricata might miss novel exploits, Zeek's ability to log *all* network activity, including anomalous protocol behaviors or unexpected data payloads, can provide the crucial early indicators. Community-shared Zeek scripts can be rapidly deployed to hunt for patterns associated with newly discovered threats before official signatures are available.

Leveraging the Community as a Force Multiplier

The true power of open-source isn't just the code; it's the community. Global security teams, researchers, and enthusiasts constantly share threat intelligence, develop new detection rules, and refine existing tools. Platforms like GitHub, mailing lists, and specialized forums become hubs for real-time intel sharing. When a new threat emerges, these communities often develop and distribute detection logic for tools like Zeek and Suricata days, even hours, before commercial vendors can. For a security team operating with limited resources, tapping into this collective intelligence is a strategic imperative. It's the difference between reacting to a known threat and proactively hunting for shadows.

The Engineer's Verdict: Open Source for the Win?

Verdict of the Engineer: When to Deploy Open Source NDIR

For organizations serious about network defense and incident response, embracing open-source tools is not an alternative; it's a necessity. These solutions offer unparalleled depth of visibility, flexibility, and a direct line to cutting-edge threat intelligence. While they require expertise to deploy and manage effectively, the return on investment in terms of defensive capability is immense.

  • Pros: Deep Visibility, High Customization, Rapid Innovation, Cost-Effectiveness, Strong Community Support, Transparency.
  • Cons: Requires Significant Expertise, Steeper Learning Curve, Potentially Higher Initial Deployment Effort, Less "Out-of-the-Box" Polish than Commercial Counterparts.

Can you afford to be blind to what's happening on your network? The answer should be a resounding 'no'. Open-source provides the eyes you need without bankrupting your operation.

Arsenal of the Operator/Analyst

  • Network Analysis Framework: Zeek
  • IDS/IPS & NSM: Suricata
  • Log Aggregation & Visualization: Elastic Stack (Elasticsearch, Logstash, Kibana)
  • Packet Analysis: Wireshark (essential for deep dives into raw captures)
  • Configuration Management: Ansible, SaltStack (for deploying and managing distributed sensor networks)
  • Essential Reading: "The Network Security Monitoring Handbook" by Richard Bejtlich, "Practical Packet Analysis" by Chris Sanders.
  • Relevant Certifications: Security+, OSCP (for broader offensive/defensive understanding), specialized vendor training for Elastic/Zeek/Suricata.

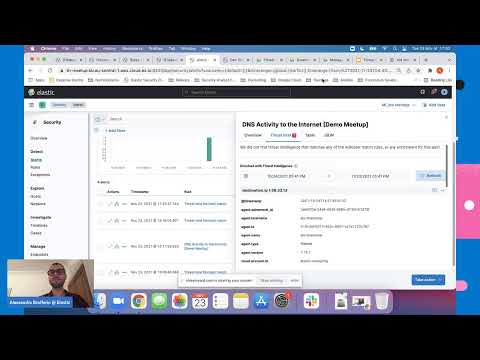
Defensive Workshop: Hunting Suspicious DNS Queries

Workshop: Detecting Malicious DNS Activity

  1. Objective: Identify DNS queries indicative of malicious activity, such as C2 communication or domain generation algorithms (DGAs).
  2. Tool: Zeek (specifically the `dns.log`) and Kibana.
  3. Step 1: Deploy Zeek Sensors. Ensure Zeek is deployed at strategic network points (e.g., egress points, internal server segments) to capture relevant DNS traffic. Configure Zeek to generate `dns.log`.
  4. Step 2: Ingest Logs into Elasticsearch. Use Logstash or Filebeat to forward Zeek's `dns.log` files to your Elasticsearch cluster.
  5. Step 3: Create a Kibana Dashboard. Navigate to Kibana and create a new dashboard.
  6. Step 4: Visualize Top DNS Queries. Add a "Data Table" visualization to show the top queried domains. Look for:
    • Very long random-looking domain names (indicative of DGAs).
    • Newly registered or suspicious-sounding domains.
    • High query volume to a single, unusual domain.
  7. Step 5: Filter by Query Type. Add filters to examine specific query types (e.g., A, AAAA, TXT) which might contain encoded data.
  8. Step 6: Correlate with Source IPs. Add a "Data Table" showing the source IPs making the suspicious queries. Investigate these IPs for signs of compromise.
  9. Step 7: Set up Alerts. Configure Kibana alerts for specific patterns, such as unusual domain length or high query rates to non-standard domains.

This granular analysis of DNS traffic, powered by Zeek and visualized in Kibana, can uncover hidden malicious command and control channels that other security tools might miss.

Frequently Asked Questions

[ { "@context": "https://schema.org", "@type": "Question", "name": "Can open-source NDIR tools replace commercial solutions entirely?", "acceptedAnswer": { "@type": "Answer", "text": "For many organizations, yes. Open-source tools like Zeek, Suricata, and the Elastic Stack provide comprehensive visibility and detection capabilities. However, commercial solutions may offer added value in terms of integrated support, managed services, or advanced AI features. The choice often depends on the organization's expertise, budget, and specific requirements." } }, { "@context": "https://schema.org", "@type": "Question", "name": "What is the typical learning curve for these tools?", "acceptedAnswer": { "@type": "Answer", "text": "The learning curve can vary. Zeek requires understanding its scripting language and log formats. Suricata involves mastering rule syntax and tuning. The Elastic Stack has its own learning curve for setup and query language (KQL/Lucene). However, abundant documentation and active community support significantly ease the process." } }, { "@context": "https://schema.org", "@type": "Question", "name": "How do I integrate Zeek and Suricata effectively?", "acceptedAnswer": { "@type": "Answer", "text": "A common approach is to run Zeek to generate detailed logs of network activity (like connection details, HTTP requests, DNS queries) and then feed these logs, along with Suricata's alerts and logs, into the Elastic Stack for centralized storage, analysis, and visualization. This provides both granular event logging and real-time threat detection." } } ]

The Contract: Securing Your Digital Perimeter

The digital battlefield is vast, and the shadows hold countless threats. Open-source tools like Zeek, Suricata, and the Elastic Stack are not mere alternatives; they are essential components of any modern, effective defense. They offer the visibility needed to detect the undetectable, the insight to understand complex attacks, and the power to respond decisively. Your contract is clear: understand your network, arm yourself with the best available intelligence, and maintain constant vigilance. The question is no longer *if* you will face an incident, but *when* and how well you will be prepared to respond. The power is in your hands, in the code, in the community. Use it wisely.

Now, I've laid out the blueprint. The real test begins when you implement it. Can you configure Zeek to log every suspicious file transfer? Can you craft a Suricata rule to detect a novel phishing attempt? Can you build a Kibana dashboard that flags anomalies before they escalate? Share your findings, your challenges, and your triumphs in the comments below. Let's build a stronger defense, together.

```

Network Forensics & Incident Response: Mastering Open Source DFIR Arsenal

The flickering screen cast long shadows across the server room, each blink of the status lights a silent testament to the digital battlefield. In this realm, where data flows like a dark river, the shadows are where the real threats lurk. We’re not here to patch systems today; we're performing an autopsy on network intrusions. The tools we wield are not always shrouded in proprietary secrecy. Sometimes, the most potent weapons are forged in the crucible of collaborative development – open source. Today, we delve into the gritty details of Network Forensics & Incident Response, armed with the power of the community.

Open-source security technologies are no longer mere alternatives; they are the backbone of proactive defense for many elite security teams. Tools like Zeek (formerly Bro), Suricata, and the Elastic Stack offer unparalleled capabilities for network detection and response (NDR). Their strength lies not only in their raw power but also in the vibrant global communities that drive their evolution. This is where the force multiplier effect truly kicks in, accelerating response times to zero-day exploits through community-driven detection engineering and intelligence sharing.

The Open Source DFIR Toolkit: Anatomy of Detection

When the digital alarm bells ring, a swift and accurate response is paramount. The ability to dissect network traffic, pinpoint anomalies, and trace the footprint of an intrusion relies heavily on having the right tools. For those operating in the trenches of cybersecurity without a bottomless budget, open-source solutions offer a formidable arsenal.

  • Zeek (Bro): More than just a packet sniffer, Zeek is a powerful network analysis framework. It provides deep visibility by generating rich, high-level logs of network activity – from HTTP requests and DNS queries to SSL certificates and FTP transfers. Its scriptable nature allows for custom detection logic tailored to specific threats.
  • Suricata: A high-performance Network Intrusion Detection System (NIDS), Intrusion Prevention System (IPS), and Network Security Monitoring (NSM) engine. Suricata excels at event-driven telemetry, providing detailed alerts and protocol analysis that are indispensable for threat hunting.
  • Elastic Stack (ELK/Elasticsearch, Logstash, Kibana): This powerful suite is the central nervous system for log aggregation and analysis. Logstash collects and processes logs from Zeek and Suricata, Elasticsearch stores and indexes this data for rapid searching, and Kibana provides a flexible interface for visualization, dashboard creation, and interactive exploration.

Use Cases: From Zero-Day to Forensics

The synergy between Zeek, Suricata, and the Elastic Stack unlocks a wide array of defensive use cases, transforming raw network telemetry into actionable intelligence.

Threat Hunting with Zeek Logs

Zeek's comprehensive logs are a goldmine for threat hunters. Imagine sifting through logs to identify:

  • Unusual DNS requests that might indicate command and control (C2) communication.
  • Suspicious HTTP headers or user agents attempting to exploit vulnerabilities.
  • Connections to known malicious IP addresses or domains.
  • Large data transfers indicative of exfiltration.

By querying these logs in Kibana, analysts can proactively hunt for threats that may have bypassed traditional perimeter defenses.

Intrusion Detection and Prevention with Suricata

Suricata acts as the frontline guardian. Its rule-based engine can detect known malicious patterns in real-time. When a suspicious packet is identified:

  • Detection Mode: An alert is generated, logged, and sent to the Elastic Stack for further investigation.
  • Prevention Mode: Suricata can actively drop malicious packets, blocking the attack before it reaches its target.

The effectiveness of Suricata is significantly amplified by leveraging community-sourced rule sets, which are often updated to counter the latest exploits.

Network Forensics Investigations

When an incident has occurred, the historical data collected by Zeek and Suricata is critical for post-event analysis. This is where network forensics truly shines:

  • Reconstructing Events: Detailed logs allow analysts to trace the attacker's path, understand the initial point of compromise, and identify the scope of the breach.
  • Identifying Malware Behavior: Analyzing Zeek's connection logs, HTTP logs, and file extraction capabilities can reveal the presence and behavior of malware.
  • Attribution Efforts: While challenging, examining network artifacts like source IPs, user agents, and communication patterns can provide clues towards attribution.

Ignoring these artifacts is akin to leaving the crime scene untouched. You cannot protect what you do not understand.

Integrations and Design Patterns

The real magic happens when these tools are integrated seamlessly. The common design pattern involves capturing raw packet data (PCAP), processing it with Zeek for deep protocol analysis and logging, and then feeding the Zeek logs alongside Suricata alerts into the Elastic Stack for centralized storage, searching, and visualization.

Example Workflow:

  1. Packet Capture: Tools like `tcpdump` or dedicated network taps capture raw traffic.
  2. Network Monitoring: Zeek analyzes the traffic, generating logs (e.g., `conn.log`, `http.log`, `dns.log`). Suricata analyzes the traffic for malicious signatures, generating alerts (e.g., `eve.json`).
  3. Log Aggregation: Logstash or Filebeat collects these logs and alerts from various sources.
  4. Data Storage & Indexing: Elasticsearch stores and indexes the processed data, making it searchable.
  5. Visualization & Analysis: Kibana allows analysts to build dashboards, query data, and hunt for threats effectively.

This pipeline transforms the chaotic stream of network data into structured, searchable intelligence. It’s the bedrock of effective incident response.

The Community as a Force Multiplier

The power of open-source lies in its collaborative spirit. The communities around Zeek, Suricata, and the Elastic Stack are not just user groups; they are active participants in the global fight against cyber threats.

  • Detection Engineering: Community members constantly develop and share new detection rules for Suricata and scripts for Zeek, addressing emerging threats faster than any single organization could alone.
  • Intelligence Sharing: Forums, mailing lists, and dedicated channels provide platforms for rapid dissemination of threat intelligence and best practices.
  • Support and Knowledge Exchange: When you hit a wall, the community is often there to offer guidance, share solutions, and help troubleshoot complex issues.

This collective effort is invaluable, especially for smaller security teams or those facing sophisticated adversaries. Ignoring this resource is a tactical error.

Veredicto del Ingeniero: ¿Vale la pena adoptar estas herramientas?

Absolutely. For any organization serious about network forensics and incident response, these open-source tools are not just viable; they are essential. They offer enterprise-grade capabilities without the prohibitive licensing costs. The learning curve can be steep, and robust implementation requires expertise, but the return on investment in terms of visibility, detection, and response efficiency is immense. The key is to invest in the expertise to deploy, configure, and leverage them effectively. The alternative is operating blind, which is a luxury no security professional can afford.

Arsenal del Operador/Analista

  • Core Tools: Zeek, Suricata, Elastic Stack (Elasticsearch, Logstash, Kibana)
  • Packet Capture: tcpdump, Wireshark
  • Log Management: Graylog, Fluentd (as alternatives or complements to Elastic Stack)
  • Threat Intelligence Platforms (TIPs): MISP (Open Source)
  • Books: "The Practice of Network Security Monitoring" by Richard Bejtlich, "Hands-On Network Forensics and Intrusion Analysis" by Joe McCray, "Practical Packet Analysis" by Chris Sanders and Jonathan Neely.
  • Certifications: SANS GCIA (Certified Intrusion Analyst), SANS FOR578 (Cyber Threat Intelligence), OSCP (Offensive Security Certified Professional) - while offensive, understanding the attacker's mindset is crucial for defense.

Taller Defensivo: Analizando Tráfico Sospechoso con Zeek y Kibana

  1. Configurar Zeek para Captura Detallada: Asegúrate de que Zeek esté configurado para generar logs clave como `conn.log`, `http.log`, `dns.log`, y `ssl.log`. Copia estos logs a tu pila de Elastic.
  2. Crear una Dashboard en Kibana: Diseña una vista en Kibana que muestre las conexiones de red más frecuentes, los hosts con mayor actividad, y los códigos de estado HTTP más comunes.
  3. Hunt for Anomalous DNS: En Kibana, busca consultas DNS inusuales:
    • Filter by `dns.question.name` for patterns that look like C2 domains (e.g., long random strings, subdomains that change frequently).
    • Look for DNS queries to non-standard ports or protocols if you're capturing that data.
    • Search for high volumes of DNS requests from a single host.
  4. Investigate Suspicious HTTP Activity: Analyze the `http.log` entries:
    • Filter for unusual User-Agent strings that don't match common browsers.
    • Look for POST requests to sensitive endpoints or unexpected file types being uploaded.
    • Identify HTTP requests with excessively long URLs.
  5. Examine SSL/TLS Handshakes: Use `ssl.log` to identify:
    • Connections to self-signed certificates or certificates with weak signature algorithms.
    • Unusual cipher suites being negotiated.
    • Connections to known malicious domains (correlate with threat intelligence feeds).
  6. Correlate with Suricata Alerts: If you have integrated Suricata alerts, cross-reference any suspicious activity found in Zeek logs with Suricata’s intrusion detection events. This provides a more comprehensive picture of potential compromise.

Preguntas Frecuentes

Q1: ¿Puedo usar Zeek y Suricata en un entorno de producción con alto tráfico?
A1: Sí, pero requiere una planificación cuidadosa de la infraestructura (hardware y red) y una optimización de la configuración para manejar el volumen de datos y el procesamiento en tiempo real.

Q2: ¿Qué tan difícil es integrar Zeek y Suricata con el Elastic Stack?
A2: La integración es relativamente sencilla gracias a herramientas como Filebeat y Logstash, que cuentan con módulos y configuraciones predefinidas para estos sistemas. Sin embargo, la optimización y el ajuste fino pueden requerir experiencia.

Q3: ¿Reemplazan estas herramientas a un firewall tradicional?
A3: No. Zeek y Suricata son herramientas de monitoreo, detección y respuesta. Un firewall se enfoca en el control de acceso y la prevención de tráfico no autorizado en el perímetro. Trabajan de forma complementaria.

Q4: ¿Cómo me mantengo al día con las nuevas amenazas y reglas de detección?
A4: Suscríbete a las listas de correo de Zeek y Suricata, sigue a investigadores de seguridad en redes sociales, y considera unirte a comunidades de inteligencia de amenazas como MISP. La actualización y el aprendizaje continuo son vitales.

El Contrato: Fortalece tu Perímetro Digital

The digital ether is a constant warzone. You've seen the open-source arms the community has forged – Zeek, Suricata, the Elastic Stack. Now, the contract is yours to fulfill. Your challenge: identify a single, critical network service within your lab or organization (e.g., a web server, a database). Configure Zeek to log all relevant traffic for that service. Then, craft a specific threat hunting query in Kibana based on common attack vectors for that service (e.g., SQL injection patterns in HTTP logs, brute-force attempts in SSH logs). Document your query, the logs you used, and what successful detection would look like. Prove that you can turn noise into actionable defense.

Threat Hunting for IOCs with the Elastic Stack: A Blue Team Playbook

The digital realm, a shadowy expanse where secrets whisper and vulnerabilities fester, demands constant vigilance. We, the guardians of Sectemple, understand that the best defense is forged from the ashes of offensive knowledge. Today, we dissect the art of threat hunting, not as a chaotic assault, but as a meticulous, analytical pursuit. Our quarry: Indicators of Compromise (IOCs), the digital footprints left by adversaries as they slither through your networks. Our weapon of choice: The Elastic Stack, a formidable arsenal for the blue team.

Elasticsearch, a titan in data collection and enrichment, offers a direct conduit to infuse your defenses with the sharpest threat intelligence. Integrated seamlessly with the Elastic Security detection engine, it empowers security analysts to identify malicious activity, transforming raw alerts into actionable intelligence through precise threat indicator matching. This meetup isn't about breaking down doors; it's about understanding the architectural weaknesses an attacker exploits, and building a fortress against them. We'll demystify Cyber Threat Intelligence (CTI) and showcase how Elastic elegantly ingests these vital feeds, forging robust CTI capabilities. For those seeking a deeper dive into the offensive arts and their defensive countermeasures, the path leads to comprehensive tutorials and cutting-edge security news.

Elastic Stack: Your Digital Fortress Architect

The Elastic Stack, a cornerstone for modern security operations, comprises Elasticsearch, Logstash, and Kibana, augmented by Beats for data shipping. This integrated system is more than just a log management solution; it's a dynamic platform for threat hunting, incident response, and continuous security monitoring. In the context of hunting for IOCs, its power lies in its ability to ingest, process, and analyze vast quantities of security-relevant data at scale.

  • Elasticsearch: The heart of the stack, a distributed search and analytics engine. It stores and indexes your security data, making it searchable in near real-time. Its powerful query DSL (Domain Specific Language) allows for complex data retrieval, crucial for identifying patterns indicative of compromise.
  • Logstash/Ingest Nodes: These components are responsible for collecting data from various sources, transforming it, and sending it to Elasticsearch. For threat hunting, this means ingesting logs from endpoints, firewalls, IDS/IPS, and crucially, threat intelligence feeds.
  • Kibana: The visualization layer. Kibana allows analysts to explore, visualize, and dashboard their data. This is where raw data transforms into insights, enabling the visual identification of IOCs and anomalous behavior.
  • Elastic Security: Built on the Elastic Stack, this integrated security solution provides SIEM, endpoint security (EDR), and threat intelligence capabilities. It offers pre-built detection rules that leverage CTI to identify known malicious activities.

Understanding Cyber Threat Intelligence (CTI)

Cyber Threat Intelligence (CTI) is not mere data; it's refined knowledge about existing or emerging threats that can be used to make informed decisions regarding the subject's response to that threat. It encompasses information about threat actors, their motives, capabilities, and the Tactics, Techniques, and Procedures (TTPs) they employ. For threat hunting, CTI serves as a crucial guide, providing known malicious IP addresses, domains, file hashes, and malware signatures – our IOCs.

"In the dark, the patterns are harder to see. CTI provides the flashlight and the map, turning chaos into an investigation." - cha0smagick

Integrating CTI into your security operations allows your detection mechanisms to proactively flag known malicious entities before they can cause significant damage. Without it, you're essentially hunting in the dark, relying solely on anomaly detection which can be prone to false positives and misses.

Ingesting Threat Intelligence Feeds with Elastic Stack

Translating raw CTI into actionable intelligence within the Elastic Stack involves several key steps. The goal is to make these IOCs readily available for matching against your ingested security logs.

Method 1: Threat Intelligence Platform (TIP) Integration

For mature security operations, a dedicated Threat Intelligence Platform (TIP) often serves as the central hub for managing and curating CTI. Many TIPs can export data in various formats (STIX/TAXII, CSV, JSON). Logstash or Elastic Agent can be configured to consume these feeds.

Example: Ingesting a CSV feed via Logstash

input {
  file {
    path => "/mnt/threat_intel/malicious_ips.csv"
    start_position => "beginning"
    sincedb_path => "/dev/null"
  }
}
filter {
  csv {
    separator => ","
    columns => ["ip_address", "threat_type", "source"]
  }
  mutate {
    convert => {
      "ip_address" => "string"
    }
  }
  date {
    match => ["timestamp", "ISO8601"]
  }
}
output {
  elasticsearch {
    hosts => ["http://elasticsearch:9200"]
    index => "threat_intel-ips-%{+YYYY.MM.dd}"
    pipeline => "cti_enrichment_pipeline"
  }
}

This Logstash configuration reads a CSV file, parses IP addresses and associated threat types, and indexes them into Elasticsearch under a specific index pattern. The `cti_enrichment_pipeline` can then be used.

Method 2: Direct Ingestion of Open-Source Feeds

Numerous open-source threat intelligence feeds are available. You can configure Logstash or, more efficiently, use Elastic Agent with built-in integrations to pull data from these sources.

Using Elastic Agent with the CTI Integration:

Elastic Agent's CTI integration simplifies the process. You can define the source URL of the threat intelligence feed (e.g., a raw URL from GitHub) and the type of IOCs it contains.

Example configuration snippet for Elastic Agent:

# agent_policy.yml
type: integration
name: threat_intelligence

# ... other configurations ...

streams:
  • dataset: threat_intelligence.stix_taxii
# For STIX/TAXII feeds data_sources:
  • type: stix_taxii
url: "https://your.tip.server/stix/taxii" collection_name: "malicious_indicators"
  • dataset: threat_intelligence.ip_list
# For simple IP lists (e.g., raw URLs from GitHub) data_sources:
  • type: ip_list
url: "https://raw.githubusercontent.com/someuser/ioc-list/main/ips.txt" threat_type: "malicious_ip" source: "github_ioc_list"
  • dataset: threat_intelligence.domain_list
# For domain lists data_sources:
  • type: domain_list
url: "https://raw.githubusercontent.com/someuser/ioc-list/main/domains.txt" threat_type: "c2_domain" source: "github_ioc_list"

This configuration allows Elastic Agent to pull IOCs directly and process them. The ingested data will be available in Elasticsearch, ready for use by the Elastic Security detection engine.

Building Robust CTI Capabilities with Elastic Security

Once your CTI is ingested into Elasticsearch, the next critical step is to leverage it within the Elastic Security SIEM and EDR solutions.

1. Creating Indicator Match Detections

Elastic Security allows you to create detection rules that match incoming event data against your CTI indices. This is the core of threat hunting with IOCs.

Within Kibana's Security App, you can navigate to Rules and create a new rule. Choose the "Indicator match" rule type.

  • Query: Define a query that looks for matches between your event data and your CTI indices. For example, to detect connections to malicious IPs:
  • network.destination.ip : _exists_ and source.ip : _exists_ and "threat_intel-ips-*" : (ip_address)
  • Index/Indices: Specify the index patterns where your security logs reside (e.g., logs-*-network).
  • Indicator Index: Specify the index pattern containing your CTI (e.g., threat_intel-ips-*).
  • Indicator Mapping: Map fields from your event data (e.g., network.destination.ip) to fields in your CTI index (e.g., ip_address).
  • Threat Type Mapping: Map the threat types from your CTI index (e.g., threat_type) to a field in your event data for enrichment.

This rule will trigger an alert whenever an event contains an IP address present in your threat intelligence feed.

2. Leveraging the CTI Feed in Endpoint Security (EDR)

Elastic Endpoint Security can ingest CTI directly. This allows the agent to perform real-time analysis on the endpoint itself, detecting malicious processes, file modifications, or network connections based on known IOCs before they even reach the SIEM.

By configuring Elastic Agent with the CTI integration and mapping these IOCs to the agent's detection rules, you create a powerful, distributed defense mechanism.

Threat Hunting Scenarios with Elastic Stack

Armed with CTI and the Elastic Stack, you can launch targeted threat hunts.

Scenario 1: Hunting for C2 Communications

Hypothesis: An adversary is communicating with a known Command and Control (C2) server.

Hunt:

  1. Ingest known C2 domains and IP addresses into Elasticsearch using the CTI integration.
  2. Create an Elastic Security rule to alert on any network connection (e.g., DNS requests, HTTP/S traffic) originating from your internal network to these CTI-listed IPs/domains.
  3. Run a search in Kibana over your network logs (e.g., proxy logs, firewall logs) for any logs containing the CTI IPs or domains in destination fields.
  4. If alerts are triggered or suspicious connections are found, investigate the source endpoint using Elastic Endpoint Security for further host-based IOCs (malware files, suspicious processes).

Scenario 2: File Integrity Monitoring for Malware Droppers

Hypothesis: Malware is being dropped onto endpoints, identifiable by its hash.

Hunt:

  1. Ingest known malicious file hashes (MD5, SHA1, SHA256) into Elasticsearch.
  2. Configure Elastic Endpoint Security to monitor file creation and modification events.
  3. Create a SIEM rule that triggers when a file hash observed on an endpoint matches a hash in your CTI index.
  4. Investigate any triggered alerts. Examine the file's origin, the process that created it, and its behavior using the endpoint security agent.

Veredicto del Ingeniero: ¿Vale la pena adoptar Elastic Stack para CTI?

The Elastic Stack, when leveraged for Cyber Threat Intelligence, is not merely a "nice-to-have"; it's a critical component of a proactive, defense-in-depth security posture. Its scalability, flexibility, and deep integration capabilities make it exceptionally well-suited for consuming, correlating, and acting upon threat intelligence. For organizations serious about moving beyond reactive security, investing in understanding and implementing CTI within Elastic is not just recommended – it's imperative. The ability to pivot from raw logs to actionable threat data by matching against known bad is a fundamental requirement for any modern SOC.

Arsenal del Operador/Analista

  • Elastic Stack: Elasticsearch, Logstash, Kibana, Beats, Elastic Agent. (Essential)
  • Threat Intelligence Feeds: Open-source lists (e.g., from GitHub repositories like MalwarePatrol, Abuse.ch) or commercial feeds.
  • Elastic Security: SIEM and EDR capabilities for detection and endpoint analysis.
  • Kibana: For visualization, dashboarding, and ad-hoc querying.
  • Books: "The Elastic Stack Solution" by Jonathan McBride, "Threat Intelligence" by Scott J. Roberts.
  • Certifications: Elastic Certified Engineer, Elastic Certified Analyst.

Taller Práctico: Fortaleciendo el Perímetro con CTI

Paso a Paso: Configurando una Alerta de CTI para IPs Maliciosas

  1. Pre-requisitos: Asegúrate de tener Elastic Stack desplegado y el Elastic Agent configurado para enviar logs de red (ej. Packetbeat, Filebeat con módulo de red) a Elasticsearch.
  2. Ingesta de CTI: Configura Elastic Agent con la integración de threat_intelligence.ip_list para consumir una lista de IPs maliciosas de un URL público (ej. una lista de IPs de malware conocidas).
  3. Verificación de Ingesta: En Kibana, navega a Security > Threat Intelligence. Verifica que las IPs se están mostrando y que son indexadas en un índice como logs-threat_intelligence-default.
  4. Crear Regla de Detección: Ve a Security > Rules > Create new rule.
  5. Tipo de Regla: Selecciona Indicator match.
  6. Nombre de la Regla: "Malicious IP Connection Detected"
  7. Indices a Escanear: Especifica tu índice de logs de red (ej. packetbeat-* o logs-network-*).
  8. Indicator Index: Escribe el patrón de tu índice de CTI (ej. logs-threat_intelligence-*).
  9. Indicator Fields: Mapea network.destination.ip (o el campo IP de destino en tus logs de red) al campo de la IP en tu índice CTI (ej. threat.ip si tu CTI fue normalizado a esa forma, o el campo original de la CTI).
  10. Threat Type Mapping (Opcional pero recomendado): Si tu CTI tiene campos de tipo de amenaza, mapea el campo de tu índice de red (ej. threat.indicator.type) al campo de tipo de amenaza en tu CTI.
  11. Acciones: Configura la acción para generar una alerta y enviarla a un webhook o crear un caso.
  12. Guardar y Habilitar: Guarda la regla y asegúrate de que esté habilitada.
  13. Prueba: Si es posible y ético, intenta realizar una conexión a una de las IPs maliciosas ingresadas desde una máquina de prueba dentro de tu red monitorizada para verificar que la alerta se dispara.

Preguntas Frecuentes

Q1: ¿Qué es un Indicador de Compromiso (IOC)?

Un IOC es una pieza de evidencia digital forense de que un incidente de seguridad ha ocurrido o está ocurriendo. Ejemplos incluyen direcciones IP maliciosas, nombres de dominio, hashes de archivos y certificados digitales.

Q2: ¿Puedo usar fuentes de CTI pagas con Elastic Stack?

Sí, Elastic Stack es muy flexible y puede ingerir datos de casi cualquier fuente de CTI, incluyendo feeds comerciales que a menudo ofrecen datos más curados y de mayor fidelidad.

Q3: ¿Cuál es la diferencia entre CTI y TTPs?

CTI se enfoca en "qué" es malicioso (IPs, hashes, dominios), mientras que TTPs (Tácticas, Técnicas y Procedimientos) describen "cómo" los adversarios operan (sus métodos y comportamientos). Ambos son vitales para una defensa completa.

Q4: ¿Elastic Security reemplaza a un firewall?

No. Elastic Security es una herramienta de detección y respuesta. Trabaja en conjunto con controles de seguridad perimetrales como firewalls, no los reemplaza. El firewall bloquea el acceso conocido, mientras que Elastic Security detecta actividades sospechosas que podrían haber eludido el perímetro.

El Contrato: Fortalece Tu Defensa

Tu red es un campo de batalla digital. Ignorar las intelignecias sobre los atacantes es como entrar en combate sin conocer al enemigo. Has visto cómo el Elastic Stack, un arma formidable en manos del defensor, puede ser el arquitecto de tu fortaleza digital. Ahora, el contrato es tuyo:

Desafío: Identifica una fuente de threat intelligence de código abierto que contenga hashes de malware. Configura un pipeline (ya sea con Logstash o Elastic Agent) para ingerir estos hashes en tu instancia de Elasticsearch. Una vez ingeridos, crea una regla de detección básica en Elastic Security para alertar si algún proceso iniciado en tu red tiene un hash que coincida con tu feed de CTI. Documenta tu proceso y comparte tus hallazgos o dificultades en los comentarios.

El conocimiento es poder, pero la aplicación es soberanía. Demuestra tu dominio.

The Most Dangerous Game: Hunting Post-Exploitation Attacks with Elastic Stack and MITRE ATT&CK

The flickering cursor on the terminal screen was my only companion in the dead of night. Logs spilled across the console like digital viscera, each line a whisper of potential compromise. We're not just patching systems anymore; we're performing autopsies on the network, dissecting the ghosts in the machine. Today, we're diving deep into the shadows of post-exploitation, hunting down the predators that slip past the initial defenses. The digital realm is a treacherous labyrinth, and only the most analytical mind, armed with the right tools and knowledge, can navigate its depths and emerge victorious.

In the cutthroat world of cybersecurity, "assume breach" isn't just a buzzword; it's the harsh reality. But with the sheer volume of data bombarding our networks and endpoints, how do you sift through the noise to find the real threats? It's like trying to find a specific bullet casing in a battlefield littered with shrapnel. This isn't about catching the initial intrusion; it's about spotting the enemy after they've already breached the walls, disguised and moving for the kill. We'll dissect the unique challenges of identifying post-exploitation activity and, crucially, leverage the open-source power of the Elastic Stack, guided by the battle-tested MITRE ATT&CK framework.

The Assumed Breach Reality

The notion that a perimeter can be perfectly secured is a fairy tale whispered in boardrooms. The truth is, attackers are already inside, moving stealthily through your network. They’re not kicking down the door; they’re picking the lock, disabling alarms, and planting their flags in critical systems. Post-exploitation is where true damage occurs – data exfiltration, privilege escalation, and establishing persistent access. Our task, as defenders, is to shift our focus from simply preventing initial access to meticulously hunting for these deep-seated compromises.

The sheer volume of data generated by modern networks is staggering. Logs from endpoints, firewalls, intrusion detection systems, network traffic analyzers – it's an ocean of information. Drowning in this data is a common fate for SOC analysts. The key isn't just collecting more data, but collecting the *right* data and having an efficient, scalable way to analyze it. This is where the Elastic Stack, a powerful suite of open-source tools, becomes indispensable.

Elastic Stack: Your Digital Forensics Toolkit

The Elastic Stack, often referred to as the ELK Stack (Elasticsearch, Logstash, and Kibana), is a robust solution for log management, real-time analysis, and data visualization. It's the Swiss Army knife for any security professional dealing with vast quantities of data.

  • Elasticsearch: A distributed, RESTful search and analytics engine. It's the heart of the stack, storing and indexing your data for rapid retrieval. Think of it as an incredibly powerful, scalable database optimized for searching through terabytes of logs.
  • Logstash: A server-side data processing pipeline that ingests data from multiple sources simultaneously, transforms it, and then sends it to a "stash" like Elasticsearch. It's your data ingestion and transformation engine, capable of parsing unstructured logs into structured, queryable formats.
  • Kibana: The visualization layer. Kibana allows you to explore, visualize, and interact with your data in Elasticsearch. Dashboards, graphs, and alerts – this is where you make sense of the chaos.
  • Beats: Lightweight, single-purpose data shippers. You can deploy Beats on your servers to send specific data types (logs, metrics, network data) to Logstash or Elasticsearch. Filebeat for logs, Metricbeat for system metrics, Packetbeat for network traffic – they are the eyes and ears on your systems.

The beauty of the Elastic Stack lies in its open-source nature and its scalability. You can start small with a single server and scale up to a massive cluster as your data ingestion needs grow. For security operations, it provides the infrastructure to aggregate logs from diverse sources, normalize them, and make them searchable in near real-time.

MITRE ATT&CK: The Attacker's Playbook

You can't defend against an enemy whose tactics you don't understand. The MITRE ATT&CK framework is a globally-accessible knowledge base of adversary tactics and techniques based on real-world observations. It's not just a list of vulnerabilities; it's a comprehensive matrix detailing how attackers operate, from initial access to command and control, and everything in between. For post-exploitation, ATT&CK is gold:

  • Tactics: High-level adversary goals (e.g., Execution, Persistence, Privilege Escalation, Defense Evasion, Credential Access, Discovery, Lateral Movement).
  • Techniques: Specific ways adversaries achieve a Tactic (e.g., PowerShell for Execution, Scheduled Tasks for Persistence, Pass the Hash for Credential Access, Remote Services for Lateral Movement).

By mapping your detection capabilities to ATT&CK techniques, you can identify gaps in your visibility and build targeted detection rules. Instead of chasing generic "suspicious activity," you can hunt for specific, known malicious behaviors.

"The first lesson at the temple is this: Know thy enemy, know thyself. Your network has secrets, and so does the attacker. Your job is to find their secrets before they find yours."

Data Collection Strategies for Post-Exploitation

To hunt effectively, you need the right data. Post-exploitation activities often involve subtle actions that can be masked in verbose logs. Focusing on key areas is crucial:

  • Endpoint Logs: Process execution logs (Sysmon is your best friend here), PowerShell logging, command-line history, registry modifications, file system activity. These are critical for detecting actions performed *on* a compromised machine.
  • Network Logs: Firewall logs, proxy logs, NetFlow/sFlow data. These help identify communication channels, lateral movement attempts, and data exfiltration.
  • Authentication Logs: Domain controller logs, Active Directory logs, VPN logs. Essential for spotting abnormal login patterns, credential access techniques, and lateral movement via authentication protocols.
  • Application Logs: Web server logs, database logs, application-specific logs. Can reveal exploitation attempts or the use of compromised applications.

Consider deploying both Filebeat (for logs) and Packetbeat (for network traffic) across your environment. Configure detailed logging on endpoints, especially Windows systems, by enabling advanced auditing policies and ideally deploying Sysmon. The goal is to capture granular details about process creation, network connections, and file modifications.

Hunting with Rules and Dashboards

Once data flows into Elasticsearch, Kibana becomes your command center. You'll want to build dashboards that visualize key security events and hunt for specific ATT&CK techniques.

  • Process Execution Monitoring: Look for unusual parent-child relationships, execution of scripts from unexpected locations, or living-off-the-land binaries (LOLBins) being used maliciously. Rules can alert on processes like `powershell.exe`, `cmd.exe`, `wmic.exe`, `rundll32.exe` with suspicious command-line arguments or from unusual parent processes.
  • Lateral Movement Detection: Monitor for repeated failed login attempts across the network, successful logins from unusual source IPs or at odd hours, or the use of remote administration tools like `psexec`, `wmic`, or scheduled tasks initiating processes on remote machines.
  • Credential Access Hunting: Detect attempts to access LSASS memory, use of Mimikatz or similar tools, creation of new local administrator accounts, or unusual access to credential stores.
  • Defense Evasion: Hunt for modifications to security settings, disabling of logging, manipulation of system time, or the execution of code in unexpected ways.

Leveraging pre-built dashboards and alert rules designed for specific ATT&CK techniques can significantly accelerate your threat hunting efforts. Projects like the Elastic Security SIEM rules and community contributions offer excellent starting points.

Engineer's Verdict: Is Elastic Stack Worth the Effort?

The Elastic Stack is a powerhouse. Its open-source roots mean you can implement sophisticated logging and analysis without a prohibitive licensing cost. However, it requires significant investment in knowledge, setup, and ongoing tuning. The initial learning curve can be steep, and maintaining performance with large data volumes demands expertise. For organizations serious about threat hunting and incident response, especially those targeting sophisticated post-exploitation attacks, the answer is a resounding yes. But don't expect it to be a set-and-forget solution. It demands skilled operators and continuous refinement. If you're looking for a plug-and-play SIEM, this might not be it. If you're building a mature, data-driven security operation, it's practically essential.

Operator's Arsenal

  • Elastic Stack (ELK): Elasticsearch, Logstash, Kibana, Beats. The core infrastructure.
  • Sysmon: Essential for detailed endpoint visibility on Windows.
  • MITRE ATT&CK Framework: Your definitive guide to attacker methodologies.
  • SIEM Rules/Dashboards: Pre-built or custom rules targeting specific ATT&CK techniques.
  • Python/KQL: For scripting, automation, and advanced querying within Elasticsearch.
  • Books: "The Web Application Hacker's Handbook" (for broader context on initial compromise), "Network Security Monitoring: Inside an Attacker's Toolkit" (for foundational principles).
  • Certifications: Consider OSCP for offensive skills that inform defense, or GIAC certifications like GCFA (Certified Forensic Analyst) or GCIH (Certified Incident Handler) for defensive expertise.

Defensive Workshop: Detecting Lateral Movement

Lateral movement is a prime target for post-exploitation hunters. Attackers use compromised credentials or exploits to move from one machine to another.

  1. Hypothesis: Attackers use compromised credentials and remote services to move laterally.
  2. Data Sources:
    • Windows Security Event Logs (Event ID 4624 for successful logins, 4625 for failed logins, especially those with Logon Type 3 - Network).
    • Sysmon Event ID 1 (Process Creation), Event ID 3 (Network Connection), Event ID 10 (Process Access).
    • Firewall/Network Logs.
  3. Hunting Techniques:
    • Monitor Logon Type 3 (Network Logins): In Kibana, query for Event ID 4624 where `LogonType` is 3. Look for source IPs or usernames associated with unusual or multiple target machines, especially outside of normal business hours.
    • Scan for Remote Service Usage: Use Sysmon Event ID 1 to detect processes like `psexec.exe`, `wmic.exe` (with remote execution commands), or `svchost.exe` being spawned by unusual parent processes on remote systems.
    • Analyze Process Execution on Endpoints: Search for common LOLBins (`powershell.exe`, `cmd.exe`, `rundll32.exe`) being executed with suspicious arguments that indicate remote command execution.
    • Correlate Network Activity: Correlate network connection logs (Sysmon Event ID 3 or Packetbeat) with process execution to identify processes making outbound connections to other internal hosts, especially those associated with authentication protocols like SMB (port 445) or RDP (port 3389).
  4. Example Kibana Query (Conceptual for Logon Type 3):
    
    {
      "query": {
        "bool": {
          "must": [
            { "term": { "event.code": "4624" } },
            { "term": { "winlog.eventdata.logonType": "3" } }
          ],
          "filter": [
            { "range": { "@timestamp": { "gte": "now-24h" } } }
          ]
        }
      }
    }
            
  5. Mitigation: Implement strong password policies, multi-factor authentication (MFA) everywhere possible, principle of least privilege, regularly audit administrative accounts, and restrict administrative access between network segments.

Frequently Asked Questions

Q1: Is Elastic Stack truly free?

The core components (Elasticsearch, Logstash, Kibana, Beats) are open-source and free to use. Elastic also offers commercial features and support, but the fundamental logging and analysis capabilities are available without cost.

Q2: How much data can the Elastic Stack handle?

It's highly scalable. With proper cluster sizing, hardware, and configuration, it can handle petabytes of data. However, performance tuning is critical for large-scale deployments.

Q3: What is the difference between Logstash and Beats?

Beats are lightweight data shippers installed on edge machines to collect specific types of data and send them to Logstash or Elasticsearch. Logstash is a more powerful, server-side data processing pipeline that can ingest from multiple sources, transform data, and output to various destinations.

Q4: Can I use Elastic Stack for threat intelligence feeds?

Yes, you can ingest threat intelligence feeds into Elasticsearch and use Kibana to visualize and correlate them with your internal security event data, enhancing your threat hunting capabilities.

The Contract: Your First Threat Hunt

The digital shadows are deep, and the predators are patient. You’ve seen the tools and the methodologies. Now, it’s time to act. Your contract is this: armed with the principles of the MITRE ATT&CK framework and the power of the Elastic Stack, identify a specific post-exploitation technique within your own environment (or a lab environment). For example, hypothesize how an attacker might use PowerShell for persistence (T1059.001). Then, define the data you would need, craft a conceptual Kibana query or set of alerts to detect it, and outline the mitigation steps an organization should take. Document your findings, even if it's just a thought experiment.

This isn't about catching the digital dragons; it's about understanding their flight paths. Now, go forth and hunt. The network's integrity depends on it. Share your hunting strategies or any insights you've gained in the comments below. Let's build a stronger defense together.

For more insights into the dark arts of cybersecurity, explore our archives and join the ranks of the vigilant. Visit Sectemple for more tutorials, news, and analyses.

Mastering Intrusion Detection: A Deep Dive into Zeek and Elastic for Incident Response

The digital realm is a battlefield, and an effective intrusion detection system (IDS) is your frontline defense. In the shadowed alleys of cyberspace, understanding how these systems work isn't just a skill; it's survival. This isn't about theory; it's about dissecting the enemy's approach to build impregnable fortresses. Today, we're pulling back the curtain on intrusion detection, leveraging the power of Zeek (formerly Bro) and the analytical might of the Elastic Stack.

Intrusion detection is a cornerstone for any serious cybersecurity professional. It's the silent sentinel, the digital bloodhound sniffing out the faint scent of compromise. In this post, we'll transform the raw data from a live webcast into actionable intelligence, equipping you not just with knowledge, but with the tools to actively hunt threats. We’ll move beyond the superficial, diving deep into the mechanics of detection, incident response, and the career pathways it unlocks. Consider this your initiation into the elite ranks of threat hunters and incident responders.

Table of Contents

Intro and Agenda

The digital shadows lengthen, and the whispers of an intrusion become a deafening roar if you're not listening. This webcast isn't for the faint of heart. It's a deep dive for those who want to understand the anatomy of an attack by dissecting the data it leaves behind. We're armed with Zeek, the silent observer, and Elastic, the all-seeing eye, to build a robust incident response capability. Let's break down the agenda:

Intrusion Detection Training Resources

Before we dive into the trenches, let’s talk about the arsenal available. Continuous learning is paramount in this game. For those serious about elevating their skills, the Advanced Intrusion Detection learning path is your next logical step. Mark's blogs, found at https://ift.tt/82M4UtS, offer granular insights into the tactics and techniques that matter. Don't underestimate the power of a free account on Infosec Skills; it’s your gateway to hands-on practice. And for the truly ambitious, the monthly challenges and the Infosec Accelerate Scholarship program present opportunities to fast-track your career.

What is Intrusion Detection?

At its core, intrusion detection is the process of monitoring network or system activities for malicious activities or policy violations. It’s about identifying the "noise" that signifies something sinister. An IDS acts as the vigilant guard, flagging suspicious patterns that deviate from the norm, hinting at an adversary's footprint.

Who Should Learn Intrusion Detection?

This skill isn't confined to a single role. Security analysts, SOC operators, incident responders, threat hunters, penetration testers, and even system administrators responsible for secure environments all benefit. If you're tasked with protecting digital assets, understanding how to detect and respond to breaches is non-negotiable.

Main Intrusion Detection Tasks and Tools

The tasks involved range from passive monitoring and log analysis to active threat hunting and forensic investigation. The tools are as varied as the threats themselves. We will focus on:

  • Zeek: A powerful network analysis framework that transforms raw network traffic into high-level security metadata. It's not just an IDS; it’s a versatile security monitoring tool.
  • Elastic Stack (Elasticsearch, Logstash, Kibana): A robust platform for searching, analyzing, and visualizing log data. Kibana, in particular, transforms complex datasets into digestible dashboards and alerts.
  • Brim Security: A modern, open-source tool that simplifies the process of analyzing Zeek logs, making the data accessible for incident response.

Intrusion Detection Career Path and Roles

The path often starts in a Security Operations Center (SOC) as a Tier 1 analyst, triaging alerts. From there, specialization can lead to Tier 2/3 SOC analyst roles, incident response, forensic analysis, malware analysis, or threat intelligence. Each role demands a deep understanding of detection mechanisms.

3 Types of Intrusion Detection

Broadly, intrusion detection systems fall into three categories:

  1. Network Intrusion Detection Systems (NIDS): Monitor network traffic for suspicious patterns. They analyze packets traversing the network, looking for known attack signatures or anomalous behavior.
  2. Host Intrusion Detection Systems (HIDS): Monitor individual hosts (servers, workstations) for malicious activity. They analyze system logs, file integrity, and running processes.
  3. Hybrid Intrusion Detection Systems: Combine elements of both NIDS and HIDS to provide a more comprehensive view.

Intrusion Detection and the MITRE ATT&CK Matrix

Mapping your detection capabilities to the MITRE ATT&CK framework is a critical exercise. It helps identify gaps in your visibility and ensures your defenses are aligned with real-world adversary tactics, techniques, and procedures (TTPs). Zeek and Elastic, when properly configured, can provide telemetry for a significant portion of these TTPs.

Poll Question: Have You Used Intrusion Detection Tools?

During the webcast, a poll revealed that a significant majority of participants have utilized intrusion detection tools, underscoring their relevance. However, the learning curve and complexity remain challenges for many. This highlights the need for practical, hands-on training like what we're discussing today.

Intrusion Detection Demo Overview

The live demonstration focused on a practical scenario: responding to a potential security incident using Zeek logs and the Elastic Stack. The workflow involved capturing network traffic, processing it with Zeek, and then feeding the resulting logs into Elastic for analysis and visualization.

Intrusion Detection Scenario

Imagine receiving an alert about suspicious outbound traffic from a critical server. Is it legitimate communication, or has a host been compromised and is now exfiltrating data? This is where a well-configured IDS pipeline becomes invaluable.

Getting PCAP Files from Malware-Traffic-Analysis.net

For realistic incident response training, access to real-world network traffic is essential. Malware-Traffic-Analysis.net is an excellent resource for downloading PCAP (Packet Capture) files that simulate malicious network activity. These files are the raw ingredients for our analysis.

Using Brim to Turn PCAP Files into Zeek Logs

Raw PCAP files are dense and difficult to parse directly. This is where Zeek shines, and Brim makes using Zeek accessible. Brim securely processes PCAP files, generating structured Zeek logs. These logs are not just packet dumps; they are rich security metadata, distilling network conversations into actionable fields like connection details, protocol usage, and file transfers. Running Zeek through Brim allows us to convert those raw packets into a format that's much more amenable to analysis, turning noise into signal.


# Example: Using Brim CLI (conceptual)
brimcap --zkg Zeek --output-dir ./zeek_logs capture.pcap

Overview of Using Elastic for Incident Response

The Elastic Stack is our command center. Elasticsearch acts as the distributed search and analytics engine, capable of handling massive volumes of log data. Logstash (or Beats) is used for data ingestion and transformation, while Kibana provides the visualization layer. This trio allows us to ingest Zeek logs, index them for fast searching, and build dashboards to monitor our environment and hunt for threats.

Uploading CSV File from Brim to Elastic

After processing PCAP with Brim, you can export the Zeek logs in a structured format, such as CSV. This CSV can then be ingested into Elastic. While direct Zeek log ingestion is often preferred for richer data, CSV export provides a straightforward method to get the data into Elasticsearch for initial analysis or in environments where direct log parsing is challenging.


# Conceptual: Exporting from Brim and importing to Elasticsearch
# 1. Export from Brim: brimcap --export-csv <pcap_file> > zeek_logs.csv
# 2. Ingest into Elasticsearch using Filebeat or Logstash ingest pipeline

Types of Data to Ship to Elastic for Incident Response

Beyond network logs, a comprehensive incident response strategy requires ingesting various data sources:

  • Endpoint logs: Process execution, registry changes, file activity (e.g., from Elastic Agent or Auditbeat).
  • Authentication logs: Active Directory or other identity provider logs.
  • Firewall logs: Network traffic flow and policy enforcement.
  • Application logs: Web server logs, database logs, etc.
  • Cloud provider logs: AWS CloudTrail, Azure Activity Logs.

The more telemetry you have, the clearer the picture of an intrusion becomes.

Elastic Integrations for Azure and Cloud Services

Elastic offers robust integrations for major cloud platforms like Azure and AWS. These integrations, often managed via Elastic Agent, streamline the collection of cloud-specific logs, such as Azure Activity Logs or AWS CloudTrail events. This allows you to maintain a unified view of your on-premises and cloud environments within a single Elastic instance.

Exploring the Data and Log Files in Elastic

Kibana's Discover tab is your primary interface for exploring raw log data. You can filter by time, search for specific keywords, and inspect individual log entries. Understanding the schema of Zeek logs (e.g., `conn.log`, `http.log`, `dns.log`) is crucial for effective querying. For example, to find suspicious DNS requests:


# KQL query in Kibana Discover
_index: "zeek-logs-*" AND dns.query:"*.ru"

Types of Zeek Log Records

Zeek generates a multitude of log types, each providing a different lens into network activity:

  • Conn.log: Connection logs detailing TCP, UDP, and ICMP connections.
  • Http.log: HTTP transaction logs, including URLs, methods, user agents, and response codes.
  • Dns.log: DNS query and response records.
  • Ssl.log: SSL/TLS certificate and connection details.
  • Files.log: Records of files transferred over the network, with hashing information.
  • Email.log: SMTP transaction details.

Mastering these logs is key to understanding network behavior.

Using Elastic Dashboards for Incident Response

Static log exploration can only go so far. Elastic Dashboards transform raw data into dynamic visualizations. Pre-built dashboards for Zeek logs can provide immediate insights into network traffic volume, top talkers, protocol distribution, and potential anomalies. You can customize these or build your own to focus on specific threats.

Using Elastic Rules for Detections and Alerts

Detection Engineering is where proactive defense truly happens. Elastic Security provides a framework for creating detection rules. These rules can be signature-based (looking for specific patterns in logs), threshold-based (triggering when metrics exceed a certain level), or even machine learning-based. When a rule triggers, it generates an alert, which can then be investigated within Kibana's Case Management or integrated with ticketing systems.


// Example of a simple Elastic Rule (conceptual)
{
  "name": "Suspicious Outbound HTTP",
  "type": "machine_learning",
  "index": "zeek-logs-*",
  "query": { "term": { "event.category": "network" } },
  "threshold": 10,
  "anomaly_threshold": 20,
  "machine_learning_job_id": "..."
}

Integrating Open-Source Threat Intelligence into Elastic

Augmenting your detection capabilities with open-source threat intelligence feeds is a force multiplier. Tools like MISP (Malware Information Sharing Platform) can be used to aggregate IOCs (Indicators of Compromise) like malicious IPs, domains, or hashes. Elastic Security can ingest these IOCs and correlate them against your ingested data, automatically flagging potentially malicious activity.

Hands-On Training and Certifications for Elastic

While this post provides a conceptual overview, true mastery requires hands-on practice. For those looking to formalize their expertise, certifications like the Elastic Certified Engineer are invaluable. Additionally, platforms like Infosec Skills offer practical labs using Elastic, preparing you for real-world incident response scenarios.

Sample Logs for Elastic Elasticsearch

When experimenting, having representative logs is crucial. Beyond the PCAP files from malware-traffic-analysis.net, consider generating your own synthetic logs mimicking common attacks or simply capturing normal traffic to establish a baseline. Elastic's documentation and community forums are excellent resources for finding sample datasets.

Filtering Relevant Data with Zeek and Elastic

The sheer volume of data can be overwhelming. Zeek, with its extensive scripting capabilities, can pre-filter and enrich logs, reducing the data volume sent to Elastic. Within Elastic, precise KQL (Kibana Query Language) or Elasticsearch Query DSL queries are essential for narrowing down investigations. For instance, filtering for only `http.log` entries from a suspicious IP:


_index: "zeek-logs-*" AND http.status_code >= 400 AND src_ip:"192.168.1.100"

What to Do After Setting Up Intrusion Detection Tools

Deployment is just the first step. The real work is in tuning your rules, establishing baselines, practicing incident response playbooks, and continuously reviewing your telemetry. Alert fatigue is real; diligent tuning is the only remedy. Regularly assess your detection coverage against emerging threats.

Progress on Alert Fatigue

The industry is actively working on reducing alert fatigue through better correlation, risk-based alerting, and machine learning models that prioritize genuine threats. However, skilled analysts who can effectively tune systems and investigate alerts remain indispensable. Tools like Elastic's SIEM capabilities are designed to help manage this, but human expertise is the final layer.

Setting Up Machine Learning Rules in Elastic

Elastic's Machine Learning features can detect anomalies that signature-based rules might miss. This involves training models on your data to identify deviations from normal behavior. For example, unusual login patterns, unexpected data transfer volumes, or new process executions on a host can be flagged by ML jobs.

Presenting Elastic Data to Management

Management doesn't need raw logs; they need answers. Translate your findings into business impact. Use clear, concise dashboards that highlight key metrics: number of incidents, average time to detect, types of threats, and the business risk associated with them. Focus on trends and actionable insights, not technical minutiae.

Advice for Getting Started in Intrusion Detection

Start small. Get comfortable with one tool, like Zeek, and a visualization platform, like Kibana. Practice with publicly available PCAP files. Understand your network baseline. Learn to ask the right questions of your data. And never stop learning; the threat landscape is constantly evolving.

Infosec Accelerate Scholarship Program

For individuals passionate about cybersecurity but facing financial barriers, the Infosec Accelerate Scholarship Program offers a pathway to critical training and certifications. It’s a program designed to cultivate the next generation of cyber defenders.

Infosec Skills On-Demand Training and Live Boot Camps

Whether you prefer to learn at your own pace or thrive in live, instructor-led environments, Infosec Skills offers a comprehensive suite of resources. Their on-demand courses and boot camps cover a vast range of cybersecurity topics, including deep dives into tools like Zeek and Elastic.

Veredicto del Ingeniero: ¿Vale la pena adoptar Zeek y Elastic?

Adopting Zeek and the Elastic Stack for intrusion detection and incident response is not just recommended; it's becoming a de facto standard for organizations serious about their security posture. Zeek's ability to generate rich, high-level metadata from network traffic is unparalleled. It provides context that raw packet captures lack, enabling faster analysis. Elastic, on the other hand, offers a scalable, powerful platform for ingesting, storing, searching, and visualizing this data. While the initial setup and tuning can be complex, the long-term benefits in terms of threat detection, hunting capabilities, and efficient incident response are immense. For any team looking to mature their security operations, this combination is a critical investment in their defensive infrastructure. Ignoring these tools is akin to sending your soldiers into battle unarmed.

Arsenal del Operador/Analista

  • Network Traffic Analysis Tool: Zeek (with Brim for log processing)
  • SIEM/Log Analytics Platform: Elastic Stack (Elasticsearch, Logstash/Beats, Kibana)
  • Data Sources: Network PCAPs, Endpoint Logs (Elastic Agent), Firewall Logs, Cloud Logs
  • Recommended Learning: Infosec Skills platform, advanced IDS courses, MITRE ATT&CK framework
  • Key Resource: Malware-Traffic-Analysis.net for PCAP samples
  • Threat Intelligence Integration: MISP, Open Source IOC feeds
  • Essential Certifications: Elastic Certified Engineer, GIAC certifications (GCIA, GCIH)
  • Essential Reading: "The Practice of Network Security Monitoring" by Richard Bejtlich, Zeek documentation

Taller Práctico: Fortaleciendo tu Detección con Reglas en Elastic

  1. Objetivo: Implementar una regla básica en Elastic para detectar comunicaciones sospechosas a dominios de alto riesgo.
  2. Requisito: Tener datos de Zeek (`dns.log`) indexados en Elasticsearch y Kibana accesible.
  3. Paso 1: Identificar una Fuente de IOCs. Utiliza una lista de dominios maliciosos conocidos. Para este ejemplo, asumiremos una lista simple. En un escenario real, integrarías un feed de threat intelligence.
  4. Paso 2: Crear un Índice de IOCs en Elasticsearch. Puedes crear un índice separado para tus dominios maliciosos. Por ejemplo, `malicious_domains` con un campo `domain_name`.
  5. Paso 3: Crear una Regla de Detección Correlacionada. En Kibana, ve a "Security" -> "Rules" y crea una nueva regla.
  6. Paso 4: Configurar la Condición de la Regla.
    • Tipo de Regla: Correlación (si estás cruzando dos fuentes de datos, o un KPI simple si solo buscas en logs Zeek).
    • Source: `dns.log` (o tu índice de logs Zeek).
    • Condition: El `dns.query` del log Zeek debe coincidir con alguno de los `domain_name` en tu índice `malicious_domains`.
    • Query DSL para la condición (ejemplo):
    
    {
      "bool": {
        "must": [
          { "term": { "event.category": "dns" } },
          {
            "terms": {
              "dns.query": [
                "malicious-domain1.ru",
                "suspicious-site.xyz",
                "phishing.com"
              ]
            }
          }
        ]
      }
    }
        
  7. Paso 5: Definir el Umbral y la Frecuencia. Establece cuántas veces debe ocurrir el evento patrocinador para generar una alerta (ej: 1 vez). Define la frecuencia de ejecución de la regla.
  8. Paso 6: Configurar la Acción de Alerta. Define qué sucede cuando la regla se dispara: generar un ticket, enviar un webhook, notificar en Slack, etc.
  9. Paso 7: Guardar y Habilitar la Regla. Asigna un nombre descriptivo, como "HighRisk-DNS-Query-Detected".
  10. Paso 8: Testear. Simula la visita a uno de los dominios maliciosos (en un entorno controlado) y verifica si la alerta se genera correctamente en Kibana.

Preguntas Frecuentes

¿Puedo usar Zeek y Elastic de forma gratuita?

Sí. Zeek es de código abierto. El Elastic Stack ofrece una versión gratuita (Basic) con funcionalidades significativas para logging y SIEM, aunque algunas características avanzadas requieren licencias de pago.

¿Qué tan preciso es Zeek en la detección de intrusiones?

Zeek no es un IDS tradicional basado en firmas. Genera metadatos ricos de la red. Su precisión radica en la capacidad de los analistas para usar estos metadatos y crear reglas o hunts que detecten anomalías y TTPs de atacantes. Es una herramienta de monitoreo de red de alto nivel.

¿Cuánto tiempo se tarda en configurar Zeek y Elastic?

La configuración básica puede tomar unas pocas horas. Sin embargo, optimizar Zeek para tu red, configurar Elastic para un volumen de datos masivo, y desarrollar reglas de detección efectivas puede llevar semanas o meses de trabajo continuo y ajuste.

¿Es posible integrar Zeek y Elastic con otras herramientas de seguridad?

Absolutamente. Elastic tiene APIs robustas que permiten la integración con sistemas de ticketing, plataformas de threat intelligence, y otras herramientas SOAR (Security Orchestration, Automation, and Response).

¿Reemplaza esta solución a un firewall tradicional?

No. Zeek y Elastic son herramientas de detección y respuesta. Un firewall es una herramienta de prevención de acceso. Trabajan de forma complementaria dentro de una estrategia de seguridad multicapa.

El Contrato: Fortalece tu Perímetro Digital

La defensa es un arte que se perfecciona con la práctica y la inteligencia. Has visto cómo Zeek destila el caos de la red en datos comprensibles, y cómo Elastic transforma esos datos en conocimiento accionable. Ahora, el contrato es tuyo: implementa una versión de este flujo de trabajo. Comienza con la descarga de un PCAP de malware-traffic-analysis.net, procesa esos logs con Zeek (puedes usar la línea de comandos o una herramienta como Brim), y luego intenta cargarlos en una instancia de Elasticsearch/Kibana (incluso las versiones gratuitas o Docker te servirán para empezar). Crea un dashboard simple para visualizar las conexiones HTTP o DNS. El objetivo no es la perfección, sino el dominio gradual. Cada paquete analizado, cada log correlacionado, es un paso para asegurar el perímetro digital.

Hunt for Intrusions: A Definitive Guide to Auditbeat System Module on Linux and macOS

The digital shadows lengthen, and in their depths, unseen actors move. While many are busy fortifying the Windows kingdom with Sysmon and the Elastic Stack, a void lingers for those guarding the Mac and Linux citadels. Historically, collecting logs from these diverse systems was akin to deciphering a babel of dialects—each with its own peculiar format, offering fragmented clues. But the game has changed. Enter the Auditbeat System module, a beacon in the gloom, much like Sysmon for your Linux fleet. This isn't just about monitoring; it's about hunting. This guide will dissect the Auditbeat System module, transforming raw system data into actionable intelligence. We'll explore its strengths and weaknesses, refine its configuration, and, most importantly, learn to wield its power within Kibana to detect and neutralize intrusions before they leave indelible scars.

Table of Contents

Introduction: The Sysmon Void and Auditbeat's Arrival

The cybersecurity landscape is a constant battle of adaptation. While Windows environments have long benefited from robust endpoint visibility tools like Sysmon, the open-source and Unix-like ecosystems have often lagged behind in terms of centralized, detailed logging. This created a blind spot, a dangerous gap in a comprehensive threat detection strategy. Security teams were left patching together disparate log sources from Linux and macOS machines, a Sisyphean task made worse by inconsistent formatting and a lack of depth. The newly released Elastic Auditbeat System module aims to bridge this chasm, offering a Sysmon-like capability for a wide array of *nix systems. It's about bringing granular visibility to process execution, network connections, user activity, and installed packages—the granular details that often betray an intruder's presence.

What is the Auditbeat System Module?

Auditbeat is an open-source shipper from Elastic designed to ship audit data to the Elastic Stack. Its System module is specifically engineered to collect detailed audit information from Linux and macOS endpoints. Think of it as your digital detective, meticulously recording every relevant action on a host:
  • Process Activity: Tracks process creation, execution, and termination, including command-line arguments and parent-child relationships. This is crucial for identifying malicious scripts or unauthorized software execution.
  • Network Connections: Monitors network socket activity, logging inbound and outbound connections. Anomalous connections can indicate C2 communication or data exfiltration.
  • User and Group Activity: Records user logins, logouts, and changes to user/group memberships. Suspicious account creations or privilege escalations are prime indicators of compromise.
  • Package Installation: Logs when software packages are installed or updated. This can help detect the installation of malware or backdoors disguised as legitimate software.
  • Host Information: Gathers system configuration details, hardware, and OS information, useful for establishing a baseline and identifying unauthorized changes.
The data collected is then forwarded to Elasticsearch, where it can be analyzed, visualized, and alerted on using Kibana. This centralization is key to effective threat hunting across a distributed environment.

Advantages and Disadvantages: A Pragmatic View

No tool is a silver bullet, and Auditbeat is no exception. Understanding its limitations is as important as leveraging its strengths.

Advantages:

  • Centralized Visibility: Provides a unified view of activity across Linux and macOS fleets, simplifying monitoring and incident response.
  • Sysmon Parity (for Linux): Offers comparable granular data to Sysmon, a well-established standard for Windows endpoint monitoring.
  • Elastic Stack Integration: Seamlessly integrates with Elasticsearch and Kibana for powerful analytics and visualization.
  • Reduced Log Parsing Complexity: Standardizes log formats, eliminating the need for complex, system-specific parsing rules.
  • Real-time Data: Enables near real-time detection and response to threats.

Disadvantages:

  • Resource Consumption: Like any agent collecting detailed telemetry, Auditbeat can consume CPU and memory resources, especially on high-traffic systems. Careful tuning is required.
  • Configuration Complexity: While simpler than managing multiple audit systems, initial configuration and fine-tuning for specific threat hunting scenarios can be intricate.
  • Focus on Linux/macOS: While a strength, it means it doesn't address Windows environments directly, requiring a multi-tool approach for heterogeneous networks.
  • Maturity: As a newer module compared to some established tools, its feature set and community-developed detection rules are still evolving.

Configuring Auditbeat for Maximum Effect

Effective threat hunting hinges on precise data collection. For Auditbeat, this means mastering its configuration. The core configuration file, `auditbeat.yml`, is where the magic happens. At its heart, you'll define the paths to your Beats installation, Elasticsearch connection details, and the modules you wish to enable. The System module requires specific configuration for each data type you want to collect.
auditbeat.modules:
  • module: system
# Uncomment and configure if you want to enable this module # This module collects data about processes, network connections, and logged-in users. # Periodically run commands and report their output. Commands must be run as root. #processes: # enabled: true # period: 5s # hashes: [sha256] # Optional: Collect file hashes for executables # process.executable: /usr/bin/ ? # # Use 'include_lines' and 'exclude_lines' to filter the command output. # # include_lines: [''] # # exclude_lines: [''] # Monitor network connections. #networks: # enabled: true # period: 10s # include_ranges: ['0.0.0.0/0'] # Default: Collect all connections # exclude_ranges: ['127.0.0.1/8'] # Default: Exclude loopback connections # Monitor logged-in users. #users: # enabled: true # period: 1m # Monitor host information. #host: # enabled: true # period: 1h
When configuring, consider these critical points:
  • **`period`**: This determines how frequently Auditbeat collects data for a specific metric. Shorter periods provide more granular, real-time data but increase resource usage and data volume. For threat hunting, process and network data often benefit from shorter periods (e.g., 5-10 seconds), while host information can be collected less frequently (e.g., hourly).
  • **`hashes`**: Enabling hash collection (like SHA256) for processes is invaluable for threat intelligence. You can later compare these hashes against known malware signatures.
  • **Filtering (`include_ranges`, `exclude_ranges`)**: Carefully define network connection ranges to avoid ingesting noisy, irrelevant data (like internal network chatter you already trust or extensive loopback traffic). The goal is to capture what matters for detecting external threats.
  • **Resource Monitoring**: Keep an eye on system performance after deployment. If resource usage spikes, gradually increase the `period` for less critical modules or implement more aggressive filtering.

Threat Hunting with Auditbeat Data in Kibana

Data without insight is just noise. Kibana transforms Auditbeat's telemetry into a formidable threat hunting platform. Here's how to start: 1. **Explore Discover:** Navigate to the "Discover" tab in Kibana and select your Auditbeat index pattern. You'll see raw events flowing in. Filter by `event.module: "system"` to focus on system module data. 2. **Process Activity Hunting:**
  • Suspicious Processes: Search for processes running with unusual names, in strange locations (`process.executable`), or with suspicious command-line arguments (`process.args`). For instance, `process.args: "-c"` might indicate a shell execution.
  • Parent-Child Anomalies: Look for processes launched by unexpected parents. `process.parent.executable: "systemd"` launching a web server process is normal. `process.parent.executable: "user.email.client"` launching `bash` is not.
  • Known Bad Hashes: If you've enabled hash collection, use the `process.hash.sha256` field to query against threat intelligence feeds.
3. **Network Activity Hunting:**
  • Unusual Connections: Filter for connections to or from rare external IP addresses (`network.forwarded_ip` or `network.destination.ip`). Visualize these connections on a map.
  • Non-Standard Ports: Identify processes communicating over ports not typically used for their function (e.g., a process named `svchost.exe` on Linux communicating over port 4444).
  • High Connection Counts: Look for hosts making an abnormally high number of outbound connections, which could signify a compromised machine attempting to scan or communicate with multiple C2 servers.
4. **User Activity Hunting:**
  • Rogue User Creation: Search for new user accounts created outside of standard administrative procedures.
  • Unusual Login Activity: Detect logins from unexpected geographic locations or at unusual times.
5. **Kibana Dashboards & Alerts:** Leverage pre-built Auditbeat dashboards or create your own to visualize key metrics. Set up alerts for specific conditions, such as a process spawning a shell, or a connection to a known malicious IP.

Example Hunt Scenario: Detecting Lateral Movement

A common lateral movement technique involves executing commands on remote systems. Using Auditbeat, you can hunt for this by looking for processes like `ssh` or `winrm` (if running on Linux servers) being initiated by processes that shouldn't be doing so, or targeting unusual internal IP ranges. Querying for `process.executable: "ssh"` where `process.parent.executable` is not a typical user shell or management tool could be a strong indicator.

Engineer's Verdict: Is Auditbeat Worth the Effort?

If you're managing a fleet of Linux or macOS systems and have adopted the Elastic Stack, the Auditbeat System module is an indispensable addition. It intelligently bridges the visibility gap left by the absence of a direct Sysmon equivalent. While it demands careful configuration and an understanding of potential resource implications, the ability to perform detailed threat hunting on these platforms is invaluable. It turns reactive log analysis into proactive threat discovery. For organizations serious about securing their entire ecosystem, not just the Windows part, investing time in mastering Auditbeat is not just recommended – it's a necessity. It’s the closest you'll get to having eyes everywhere on your *nix infrastructure without the headache of custom scripting and disparate log parsers.

Operator's Arsenal

To effectively deploy and leverage Auditbeat, consider these essential tools and resources:
  • Elastic Stack (Elasticsearch & Kibana): The foundational platform for data storage, analysis, and visualization. A well-tuned Elasticsearch cluster is paramount.
  • Auditbeat: The agent itself. Ensure you're using the latest stable version.
  • Linux/macOS Command Line: Deep familiarity with shell scripting, process management (`ps`, `top`, `htop`), network tools (`netstat`, `ss`), and user management is crucial for understanding the data Auditbeat collects.
  • Threat Intelligence Feeds: Sources for Indicators of Compromise (IoCs) like malicious IPs, domains, and file hashes. Platforms like MISP or commercial feeds can be integrated.
  • The Web Application Hacker's Handbook: While not directly for endpoint logging, understanding common attack vectors (web app attacks leading to shell access) helps inform what you should be hunting for on the endpoint.
  • Python for Data Analysis: For advanced data manipulation and custom analytics scripts if Kibana's capabilities aren't sufficient.
  • OSCP (Offensive Security Certified Professional) Certification: Demonstrates a hands-on understanding of penetration testing techniques. Knowing how attackers operate is key to hunting them.
  • Linux Auditd: Understanding the underlying Linux audit framework (`auditd`) can provide deeper context for Auditbeat's data collection.

Practical Workshop: Setting Up Auditbeat

This workshop outlines the basic steps to install and configure Auditbeat on a Linux system.
  1. Download and Install Auditbeat: Obtain the appropriate package for your Linux distribution from the Elastic website and install it.
    
    # Example for Debian/Ubuntu
    wget https://artifacts.elastic.co/downloads/beats/auditbeat/auditbeat-8.10.4-amd64.deb
    sudo dpkg -i auditbeat-8.10.4-amd64.deb
            
    
    # Example for RHEL/CentOS/Fedora
    rpm --install auditbeat-8.10.4-x86_64.rpm
            
  2. Configure `auditbeat.yml`: Edit the main configuration file (`/etc/auditbeat/auditbeat.yml`) to specify your Elasticsearch output and enable the system module.
    
    # ============================== Auditbeat specific options ==============================
    auditbeat.modules:
    
    • module: system
    period: 5s processes: enabled: true hashes: [sha256] networks: enabled: true period: 10s users: enabled: true period: 1m # =========================== Elasticsearch output =========================== output.elasticsearch: hosts: ["your-elasticsearch-host:9200"] # username: "elastic" # password: "changeme" # =========================== Kibana =========================== # If you are already running Kibana, uncomment this to allow Auditbeat to # automatically load the dashboards. setup.kibana: host: "your-kibana-host:5601"
    Replace `your-elasticsearch-host:9200` and `your-kibana-host:5601` with your actual cluster details.
  3. Enable and Start the Auditbeat Service: Use systemd to manage the Auditbeat service.
    
    sudo systemctl enable auditbeat
    sudo systemctl start auditbeat
            
  4. Verify Data in Kibana: Access your Kibana instance, navigate to "Stack Management" -> "Index Patterns", and create an index pattern for `auditbeat-*`. You should start seeing data in the "Discover" tab.

Frequently Asked Questions

  • Q: How does the Auditbeat System module differ from Linux's native `auditd`?
    A: While `auditd` is the underlying framework on Linux, Auditbeat provides a more user-friendly, standardized output format for Elasticsearch. It simplifies configuration and data ingestion, allowing you to focus on analysis rather than log parsing.
  • Q: Can Auditbeat collect data on macOS systems?
    A: Yes, the System module is designed to function on macOS as well, collecting similar process, network, and user activity data.
  • Q: What is the impact of enabling process hashing (`hashes: [sha256]`) on performance?
    A: Calculating hashes, especially SHA256, for every executable can add overhead. Monitor system performance closely. It’s a trade-off between detailed intelligence and resource consumption, best reserved for critical systems or during active investigations.
  • Q: How can I tune Auditbeat to reduce resource usage?
    A: Increase the `period` for modules and specific data types, use more aggressive network filtering (`exclude_ranges`), and consider disabling modules that are not critical for your threat hunting strategy.

The Contract: Your First Hunt

You've armed yourself with Auditbeat, you understand its data, and you've seen how Kibana can illuminate the shadows. Now, it's time to prove your mettle. Your Contract: Detect a Suspicious Service Installation. Imagine receiving a tip: an attacker may have installed a rogue service on a critical Linux server to maintain persistence. Your task is to use Auditbeat data in Kibana to hunt for evidence of this.
  • **What specific Auditbeat fields would you query to identify the installation of a new service?**
  • **What process-related or network-related anomalies might indicate a malicious service attempting to establish persistence or beacon?**
  • **If the installation involved downloading an executable, what other Auditbeat data could corroborate this activity?**
Your response should detail your hunting query logic and the indicators you'd look for. The digital world is unforgiving; only the vigilant survive. Show me you're ready.