Showing posts with label kibana. Show all posts

APT 29 Threat Hunt: A Defensive Deep Dive into Sysmon Log Analysis

The digital shadows are long, and the whispers of nation-state actors are a constant hum beneath the surface of global networks. Today, we're not just talking about vulnerabilities; we're dissecting the methodology of APT 29, a phantom that leaves a subtle, yet dangerous, trail across Windows environments. Forget the flashy exploits; the real battle is won in the quiet, meticulous hunt for anomalies, the digital breadcrumbs left behind by adversaries who move with precision and purpose. This isn't about *how* they get in, but *how we find them once they're already inside*. This is a deep dive into threat hunting.

APT 29, also known by various aliases including Nobelium and Cozy Bear, is a sophisticated threat actor group with a well-documented history of targeting governmental, diplomatic, and critical infrastructure organizations. Their playbook is one of patience, stealth, and exploitation of trusted channels. Understanding their modus operandi is not just academic; it's a critical component of a robust defensive posture. The key to countering such advanced persistent threats lies in our ability to detect their typically low-and-slow movements before they achieve their objectives. This requires a proactive, intelligence-driven approach to security, rather than a reactive one.

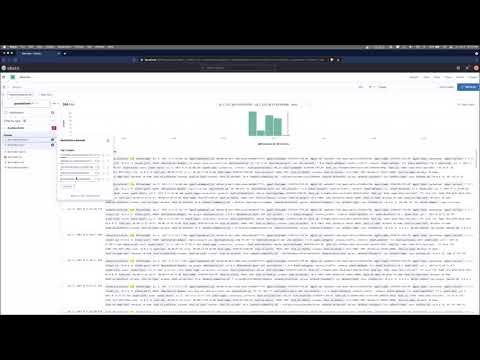
This analysis delves into a practical threat hunting exercise, focusing on the detection of APT 29 activities leveraging the power of Windows Sysmon logs, meticulously stored and analyzed within an Elasticsearch cluster. Sysmon, a system monitoring facility, provides rich, detailed event data that, when properly configured and ingested, can illuminate the activities of even the most stealthy attackers. Elasticsearch, in turn, transforms this deluge of data into a searchable, analyzable repository, enabling security analysts to sift through the noise and identify the signal.

The Anatomy of an APT 29 Incursion

APT 29's success often hinges on their ability to blend in. They are not typically brute-force attackers; their methods are subtle and often exploit reconnaissance, credential access, and lateral movement techniques that mimic legitimate administrative actions. Common tactics include:

  • Spearphishing Attachments/Links: Initial compromise often begins with highly targeted phishing campaigns, delivering malicious documents or URLs.
  • Exploitation of Vulnerabilities: They are known to exploit zero-day or previously unknown vulnerabilities in widely used software to gain an initial foothold.
  • Supply Chain Attacks: Disrupting trusted software update mechanisms to distribute malware.
  • Credential Harvesting: Techniques like pass-the-hash, Kerberoasting, or exploiting exposed credentials in memory.
  • Lateral Movement: Utilizing legitimate tools and protocols (e.g., PowerShell, WMI, RDP) to move across the network.
  • Persistence: Establishing backdoors, creating new services, or modifying scheduled tasks.

The challenge for defenders is immense. These actions, when performed on a large network, can easily be lost in the cacophony of normal operations, especially if logging is insufficient or poorly configured. This is where structured threat hunting becomes paramount.

Sysmon: The Eyes and Ears of Your Network

Windows Sysmon is an indispensable tool for any serious security professional or blue team. Developed by Mark Russinovich, Sysmon installs as a Windows service and driver that monitors and logs system activity to the Windows event log. Its granularity is exceptional, providing insights into:

  • Process creation (with command line and parent process details)
  • Network connections (including the process making the connection)
  • Changes to file creation time
  • Registry modifications
  • WMI activity
  • Process injection attempts
  • DNS queries
  • Clipboard manipulations
  • Named pipe creation and connection
  • Remote thread creation

A well-tuned Sysmon configuration is crucial. An overly verbose configuration can overwhelm your logging infrastructure, while an insufficient one will leave critical gaps. The goal is to capture enough detail to reconstruct an attacker's actions without drowning in false positives. This requires careful tuning based on your environment and threat intelligence.

Elasticsearch: Correlating the Chaos

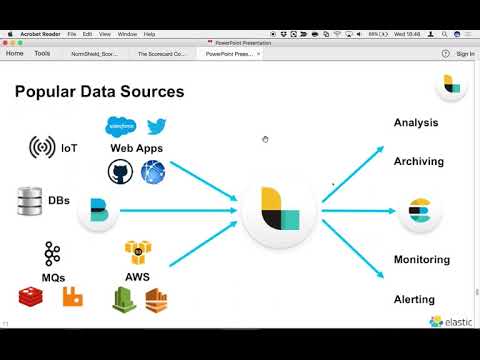
Raw Sysmon logs, while detailed, are difficult to sift through manually. Storing them in a centralized logging platform like Elasticsearch transforms them into a powerful investigative tool. Elasticsearch, as part of the Elastic Stack (ELK), provides a scalable, searchable database for log data. When combined with Kibana for visualization and Logstash or Filebeat for ingestion, it creates a robust solution for security monitoring and threat hunting.

Here's why this combination is potent:

  • Centralization: All logs in one place, accessible from a single interface.
  • Searchability: Powerful query language (Lucene/KQL) to find specific events or patterns across vast datasets.
  • Correlation: Ability to correlate events from different sources (Sysmon, firewall logs, authentication logs).
  • Visualization: Kibana dashboards to present data in an understandable, actionable format.
  • Alerting: Setting up rules to trigger alerts when specific suspicious activities are detected.

Threat Hunting Hypothesis: APT 29 Persistence via Scheduled Tasks

One common persistence mechanism employed by APT actors is the creation of scheduled tasks that execute malicious payloads. These tasks can be disguised to appear legitimate, making them hard to spot in a sea of system events. Our hypothesis for this hunt is:

"APT 29 may be establishing persistence by creating or modifying scheduled tasks to execute unauthorized binaries or scripts."

Hunting Methodology: Leveraging Sysmon Event ID 1 and Event ID 10 in Elasticsearch

To test this hypothesis, we'll focus on specific Sysmon Event IDs within our Elasticsearch cluster. The key Event IDs we'll be querying are:

  • Event ID 1: Process Creation - This event logs when a process is created. We'll look for unusual processes being launched, especially those that might be payloads from scheduled tasks. Pay close attention to the command line arguments and the parent process.
  • Event ID 10: Process Termination - While less direct for persistence, it can help correlate the lifecycle of a suspicious process launched by a task.
  • Event ID 8: CreateRemoteThread - Crucial for detecting process injection, a technique APTs might use in conjunction with scheduled tasks to hide their execution.
  • Event ID 7: Image Load - Monitoring DLLs loaded by suspicious processes can reveal malicious components.
  • Event ID 3: Network Connection - If the scheduled task's payload attempts network communication, this event will capture it.

Querying for Suspicious Scheduled Task Activities

Let's imagine we're in Kibana, constructing our search queries. The goal is to identify tasks that are unusual in their naming, timing, or execution context.

1. Identifying Unusual Task Scheduler Processes

APT 29 might use Task Scheduler (`taskeng.exe` or `svchost.exe` for legitimate tasks, but also potentially other disguised processes). We're looking for tasks that launch unfamiliar executables or scripts.


event_id:1 AND (
  ParentImage:"C:\\Windows\\System32\\svchost.exe" AND
  Image:"C:\\Windows\\System32\\cmd.exe" AND
  CommandLine:"*/c*powershell* -enc*"
) OR (
  ParentImage:"C:\\Windows\\System32\\taskeng.exe" AND
  Image:"C:\\Windows\\System32\\rundll32.exe"
)

Explanation: This query looks for processes launched by `svchost.exe` that execute PowerShell with encoded commands (a common obfuscation technique) or tasks launched by `taskeng.exe` that invoke `rundll32.exe`. These patterns, while not inherently malicious, warrant further investigation.

2. Detecting Suspicious Command Line Arguments for Tasks

An attacker might try to execute scripts or binaries with suspicious arguments. Look for encoded commands, unsigned executables, or paths that are not standard.


event_id:1 AND CommandLine:"*powershell* -enc*" AND NOT Image:"C:\\Windows\\System32\\WindowsPowerShell\\v1.0\\powershell.exe"

Explanation: This query flags PowerShell commands executed with the `-enc` flag (indicating base64 encoded script) but originating from a non-standard PowerShell executable path, or if the command itself appears unusual. Note: The `ParentImage` filter is critical here to isolate task-spawned processes.

3. Monitoring Registry Modifications Related to Task Scheduling

While Sysmon doesn't directly log Task Scheduler's internal database modifications in real-time (that's more for the Security event log or specific Task Scheduler logs), attackers might modify related registry keys as part of their persistence. Event ID 12 and 13 (Registry Events) can be useful here.


event_id:12 AND (RegistryKey CONTAINS "HKLM\\SOFTWARE\\Microsoft\\Windows\\CurrentVersion\\Run" OR RegistryKey CONTAINS "HKCU\\SOFTWARE\\Microsoft\\Windows\\CurrentVersion\\Run")

Explanation: This query focuses on additions or modifications to the Run keys in the registry, which are common locations for persistence. While not exclusively related to scheduled tasks, it's a vital area to monitor for APT activity.

Advanced Hunting: Lateral Movement and Data Exfiltration

If APT 29 successfully establishes persistence with a scheduled task, their next move will likely be lateral movement or data staging for exfiltration. Here's how Sysmon can help:

  • Event ID 3 (Network Connection): Monitor for unusual outbound connections originating from processes associated with your scheduled tasks. Are they connecting to known malicious IPs, staging servers, or unusual ports?
  • Event ID 8 (CreateRemoteThread): If the persistent task is designed to inject malicious code into legitimate processes, your Sysmon logs will show this. Look for suspicious source/destination processes and thread start addresses.
  • Event ID 1 (Process Creation) with unusual parent-child relationships: For example, a legitimate service process spawning `cmd.exe` or `powershell.exe` is highly suspicious.

Defense in Depth: Beyond Sysmon

While Sysmon is a powerful tool, effective defense against APT 29 requires a multi-layered strategy:

  • Robust Patch Management: Keep all systems and software up-to-date to mitigate known vulnerabilities.
  • Principle of Least Privilege: Ensure users and services only have the permissions they absolutely need.
  • Network Segmentation: Isolate critical systems to limit lateral movement.
  • Endpoint Detection and Response (EDR): Modern EDR solutions offer advanced behavioral analysis that can detect APT tactics missed by traditional AV and Sysmon alone.
  • Security Awareness Training: Educate users about phishing and social engineering tactics.
  • Threat Intelligence Feeds: Integrate up-to-date threat intelligence into your SIEM and EDR.

Veredicto del Ingeniero: Sysmon es Indispensable, Pero No una Bala de Plata

Sysmon, coupled with a robust SIEM like Elasticsearch, provides an unparalleled window into system activity. It’s a cornerstone for proactive threat hunting, especially against sophisticated adversaries like APT 29. However, it’s not a silver bullet. Its effectiveness is entirely dependent on the quality of the configuration, the ingestion pipeline, and the skill of the analyst performing the hunt. A poorly configured Sysmon can be noisy and miss critical events, while a well-tuned deployment can provide the evidence needed to dismantle an attacker's operations. Investing in proper Sysmon deployment, maintenance, and analyst training is not optional; it's a critical requirement for modern cybersecurity defense.

Arsenal of the Operator/Analist

  • Sysmon: Essential for detailed Windows logging.
  • Elastic Stack (ELK): For centralized logging, searching, and visualization.
  • Kibana: The graphical interface for Elasticsearch, crucial for building queries and dashboards.
  • PowerShell: For scripting and automation, both for offense (in controlled environments) and defense.
  • Wireshark: For deep network packet analysis.
  • Nmap: For network discovery and port scanning (use ethically!).
  • Books: "The Web Application Hacker's Handbook" (though this hunt is host-based, understanding application vectors is key), "Practical Threat Hunting and Incident Response" by Justin Brown.
  • Certifications: GIAC Certified Incident Handler (GCIH), Certified Information Systems Security Professional (CISSP), Offensive Security Certified Professional (OSCP) – understanding the attacker's mindset is key to building better defenses.

Taller Defensivo: Buscando Evasión de Tiempo de Ejecución

APT actors often try to evade detection by manipulating time. This can involve delaying execution, modifying timestamps, or using time-based obfuscation. Let's craft a query to look for unusual process execution times or modifications that might indicate evasion.

  1. Identify the target: We're looking for processes that might have suspicious execution timestamps or modifications that deviate from the norm.
  2. Sysmon Event IDs to Monitor:
    • Event ID 1: Process Creation (look at `UtcTime`)
    • Event ID 12: Registry Events (look at `UtcTime` of modification)
    • Event ID 23: FileDelete (look at `UtcTime`)
    • Event ID 24: ClipboardChange (look at `UtcTime`)
  3. Construct Elasticsearch Query (KQL):

    This query looks for processes created outside typical business hours that are not system-related. This is a broad query and will require tuning.

    
    event_id:1 AND UtcTime:[now-1h/h TO now] AND NOT Image:(
      "C:\\Windows\\System32\\svchost.exe" OR
      "C:\\Windows\\System32\\wininit.exe" OR
      "C:\\Windows\\System32\\smss.exe" OR
      "C:\\Windows\\System32\\lsass.exe" OR
      "C:\\Windows\\System32\\winlogon.exe" OR
      "C:\\Windows\\System32\\conhost.exe"
    )
            

    Explanation: This query, when run during business hours, flags processes initiated in the last hour that are not standard system processes. The goal is to catch manually initiated, unauthorized activities that aren't part of normal OS operation. For actual threat hunting, you'd refine this significantly based on baselines.

  4. Considerations:
    • Baselines are crucial. What is "normal" in your environment?
    • Timezones: Ensure consistency in your logging and querying (UTC is best).
    • False Positives: Expect many. Refine your queries based on your findings.

Frequently Asked Questions

What are the primary indicators of APT 29 activity via Sysmon?

Key indicators include unusual process creation (especially PowerShell with encoded commands), suspicious network connections, modifications to persistence mechanisms like scheduled tasks or registry Run keys, and the use of living-off-the-land binaries (LOLBins) in non-standard ways.

How can I tune Sysmon configuration to reduce noise?

Start with a community-driven configuration (e.g., SwiftOnSecurity's Sysmon config) and then tailor it to your environment. Whitelist known good processes and common administrative tools, and focus on capturing details for areas that are high risk, like network connections and process creation with specific command line arguments.

Is a SIEM like Elasticsearch necessary for Sysmon analysis?

While you *can* analyze individual Sysmon logs on hosts, it's highly impractical for any network larger than a few machines. A SIEM like Elasticsearch is essential for centralization, correlation, and efficient searching across vast amounts of log data. It transforms Sysmon from a detailed logger into an actionable threat detection and hunting platform.

The Contract: Fortify Your Defenses Against APTs

You've seen the blueprint. You understand the tactics. Now, it's time to act. Your challenge:

Analyze your network's Sysmon configurations and your SIEM's query logs. Identify 3 specific queries you can implement to hunt for the persistence techniques discussed in this post. Document these queries and the expected outcomes. If you find something, document it safely. If you don't, document *why* you believe you didn't identify any suspicious activity (is your logging too sparse, or are you truly clean?). Share your findings (or your lack thereof) and your queries in the comments below. Let's turn this knowledge into actionable defense.**

For more in-depth analysis and tutorials on threat hunting, cybersecurity news, and bug bounty strategies, continue to explore the archives at Sectemple.

Stay vigilant. The digital night is always watching.

Threat Hunting with Elastic Stack: Mastering Data Exploration and Visualization with Kibana

The digital shadows whisper secrets. In the hushed corners of the network, anomalies lurk, unseen by the casual observer. These aren't just glitches; they're breadcrumbs left by adversaries, potential indicators of compromise. To hunt them effectively, we need to see what's hidden. This is where Kibana, the visual soul of the Elastic Stack, becomes our most potent tool. Forget staring blankly at raw logs; we're about to turn data chaos into actionable intelligence.

As an operator in this digital battlefield, your primary objective is not just detection, but proactive identification of malicious intent. The Elastic Stack, with its powerful Elasticsearch for search and analytics, and Kibana for visualization, provides a robust platform for this. This article delves into the heart of Kibana, showing you how to dissect, explore, and visualize your data to uncover the threats that hide in plain sight. We’ll transform raw event streams into a visual narrative of potential breaches, empowering you to build stronger defenses.

Table of Contents

The Analyst's Canvas: Why Kibana Matters

In the realm of cybersecurity, data is the currency of truth. Billions of log entries, network flows, and system events flood our infrastructure daily. Without a sophisticated way to process and understand this deluge, critical threats can go unnoticed, festering until they erupt into catastrophic breaches. Kibana acts as our interpreter, translating the complex, often cryptic language of raw data into comprehensible visual insights. It’s not just about pretty charts; it’s about pattern recognition, anomaly detection, and ultimately, the ability to preemptively identify and neutralize threats before they achieve their objectives.

For a threat hunter, Kibana offers several key advantages:

  • Intuitive Exploration: The Discover interface allows for rapid searching and filtering of indexed data, enabling quick hypothesis validation.
  • Powerful Visualization: From simple bar charts to complex heatmaps and network graphs, Kibana provides a diverse array of visualization types to represent data in meaningful ways.
  • Interactive Dashboards: Consolidate your findings into dynamic dashboards that offer a bird's-eye view of your security posture and highlight potential areas of concern.
  • Real-time Monitoring: Visualize live data streams to identify emergent threats as they occur.

This isn't about running a simple `grep` on a log file. This is about architecting a system that can ingest, process, and visualize vast quantities of security-relevant data at scale. It's about building a comprehensive intelligence picture that informs your defensive strategy.

Navigating the Data Ocean: Kibana Discover

The Discover application in Kibana is your primary interface for querying, examining, and understanding the data indexed in Elasticsearch. Think of it as your digital magnifying glass, allowing you to zero in on specific events and patterns. When you’re hunting for subtle indicators of compromise, the ability to quickly filter, sort, and analyze logs is paramount.

Here’s how to leverage Discover effectively:

  1. Index Pattern Selection: First, ensure you have selected the correct index pattern that corresponds to your security logs (e.g., `logs-*-*`, `filebeat-*`). This tells Kibana which data you want to query.
  2. Time Range Filter: Always set a precise time range. For threat hunting, you might be looking at specific recent periods or historical events that suggest persistent malicious activity.
  3. KQL (Kibana Query Language): Utilize KQL for precise filtering. Instead of just keywords, use field-based queries. For instance, to find suspicious PowerShell execution commands, you might query `process.name: "powershell.exe" AND command_line: "*Invoke-Expression*"` or `process.name: "powershell.exe" AND command_line: "*encodedCommand*"`.
  4. Column Customization: Add relevant fields to your search results display. For security analysis, `timestamp`, `source.ip`, `destination.ip`, `user.name`, `process.name`, `event.action`, and `message` are often critical.
  5. Expanding Documents: Click on any log entry to expand it and view all its associated fields and their values. This is crucial for detailed forensic analysis of individual events.
  6. Saving Searches: If you identify a valuable query pattern, save it. This allows you to quickly re-run the search later or use it as the basis for visualizations.

The power here lies in the granularity. Attackers often operate with stealth, using seemingly innocuous commands or processes. Your ability to craft precise KQL queries can reveal these hidden actions. For example, spotting a `powershell.exe` process executing with a base64 encoded command is a significant red flag.

"The attacker knows your system's architecture better than you do. Your logs are their footprints. Your job is to see them." - Unknown Operator

Painting the Threat Landscape: Dashboards and Visualizations

While Discover is excellent for deep dives, dashboards provide the high-level overview necessary for understanding your organization's security posture at a glance. Kibana offers a rich ecosystem of visualization types that can transform raw data into impactful graphical representations.

Common Visualization Types for Threat Hunting:

  • Bar Charts: Useful for showing counts of events by category, such as the top source IPs connecting to a suspicious port, or the most frequent process executions.
  • Line Charts: Ideal for tracking trends over time. For instance, monitor the volume of failed login attempts or the rate of outbound connections to known malicious IPs. Spikes can indicate active attacks.
  • Pie Charts: Good for illustrating proportions, such as the distribution of operating systems, or the percentage of different types of security alerts.
  • Data Tables: Essentially a more enhanced version of Discover, allowing you to display aggregated data in a tabular format with sorting and filtering.
  • Maps: Visualize geographic distribution of IP addresses. If you see a sudden surge of connections from an unexpected region, it warrants investigation.
  • Heat Maps: Overlay frequency data onto a grid, highlighting areas of high activity or concurrency.
  • Tag Clouds: Visually represent the most frequent terms in a dataset, which can be useful for quickly spotting keywords in log messages.

Building an Effective Security Dashboard:

  1. Define Your Objectives: What specific threats or activities are you trying to monitor? (e.g., brute-force attacks, unusual process activity, data exfiltration attempts).
  2. Select Relevant Visualizations: Choose visualization types that best represent the data for your objectives.
  3. Use Precise Queries: Each visualization should be backed by a specific Elasticsearch query (often derived from saved Discover searches).
  4. Organize Logically: Group related visualizations together. Place critical, high-level indicators at the top.
  5. Set Appropriate Time Filters: Ensure dashboards are configured to display data over a relevant time frame, often with live-updating capabilities.
  6. Iterate and Refine: Your dashboard is a living document. As you learn more about the threats you face, update and enhance your dashboards accordingly.

Imagine a dashboard showing a sudden spike in `powershell.exe` executions from a specific user account, coupled with an increase in outbound connections to non-standard ports originating from the same host. This isn't just data; it's a story of potential compromise unfolding in real-time.

Beyond the Basics: Advanced Kibana for Threat Hunters

Once you've mastered the fundamentals, Kibana offers advanced features that can significantly enhance your threat hunting capabilities. These techniques require a deeper understanding of Elasticsearch and data modeling.

  • Lens: A powerful, drag-and-drop interface for creating visualizations. It simplifies the process of exploring data and discovering relationships without needing to write complex queries manually.
  • Timelion (or Time Series Visual Builder): Essential for comparing multiple time-series data streams. You can overlay network traffic volume with login failure rates, for instance, to identify correlations.
  • Vega Visualizations: For highly customized visualizations, Vega allows you to define complex charts using JSON specifications, offering ultimate flexibility.
  • Machine Learning Features: Kibana integrates with Elastic's Machine Learning capabilities to automatically detect anomalies in your data. This can surface threats that might be too subtle for manual observation.
  • SIEM (Security Information and Event Management): Kibana forms the front-end for Elastic SIEM, providing pre-built dashboards, rules, and case management specifically designed for security analysts.

For example, using Timelion, you could create a visualization that shows the ratio of DNS queries to established TCP connections. An unusual deviation could indicate DNS tunneling, a common technique for command and control or data exfiltration.

Engineer's Verdict: Is Kibana Your Go-To?

Kibana is not merely an add-on; it's an indispensable component of any mature threat hunting operation leveraging the Elastic Stack. Its strength lies in its flexibility, power, and integration with Elasticsearch. For organizations already invested in the Elastic ecosystem, Kibana is the obvious choice for data exploration and visualization.

Pros:

  • Deep integration with Elasticsearch, enabling near real-time analysis of massive datasets.
  • A wide array of visualization types catering to diverse analytical needs.
  • Constantly evolving with new features, including advanced ML capabilities and dedicated SIEM functionalities.
  • Open-source roots mean broad community support and a vast pool of resources and knowledge.

Cons:

  • Can have a steep learning curve for complex queries and custom visualizations.
  • Performance can be a bottleneck if Elasticsearch is not optimally tuned or provisioned.
  • While powerful, it requires a solid understanding of data structures and query languages to maximize its potential.

Verdict: If you're serious about threat hunting and using the Elastic Stack, Kibana is a non-negotiable tool. Its ability to make vast amounts of data comprehensible and actionable is unparalleled. For those starting out, focus on mastering Discover and basic visualizations, then gradually explore more advanced features like Timelion and ML. For organizations needing a comprehensive SIEM solution, Elastic SIEM within Kibana is a highly competitive offering.

Operator's Arsenal: Essential Kibana Resources

To truly master Kibana for threat hunting, equip yourself with the right tools and knowledge:

  • Elastic Stack Documentation: The official documentation is your bible. It's comprehensive and regularly updated.
  • Kibana User Guide: Specifically focus on the sections for Discover, Visualize, and Dashboard.
  • Elastic Blog: Stay updated on new features, use cases, and threat hunting strategies.
  • Online Courses: Look for courses specifically on the Elastic Stack, Kubernetes Security, and Threat Hunting. Platforms like Udemy, Coursera, or even specialized security training providers often have relevant content.
  • Books: "Monitoring Elasticsearch" or "The Definitive Guide to Elasticsearch" can provide deeper insights into the underlying data engine. While not Kibana-specific, understanding Elasticsearch translates directly to better Kibana usage.
  • Community Forums: Engage with other users on the Elastic Discuss forums for tips, tricks, and solutions to common problems.
  • Playgrounds: Utilize readily available Elasticsearch/Kibana sandbox environments or set up your own for hands-on practice.

Investing in these resources will accelerate your learning curve and transform you from a log viewer into a data-driven threat hunter.

Defensive Workshop: Building a Threat Hunting Dashboard

Let's build a basic dashboard to monitor suspicious command-line activity. This is a simplified example; real-world dashboards will be far more complex.

  1. Navigate to Dashboard: In Kibana, go to "Dashboard" and click "Create dashboard".
  2. Add a Visualization: Click "Create new" and select "Visualize".
  3. Choose a Visualization Type: Select "Data Table".
  4. Configure the Data Table:
    • Index Pattern: Select your endpoint logs index pattern (e.g., `winlogbeat-*` or similar).
    • Metrics: Add an aggregation. For "Buckets", select "Split rows".
    • Aggregation (for Rows): Choose "Terms" aggregation.
    • Field: Select `process.command_line`. Set "Size" to 10 or 20.
    • Order By: Set to "Metric: Count" (descending).
    • Field (for Metric): Select `process.name` and choose "Terms" aggregation. Set "Size" to 5. This shows which processes are associated with these command lines.
    • Field for Timestamp: Select your timestamp field (e.g., `@timestamp`).
  5. Save the Visualization: Click "Save" and give it a name like "Suspicious Command Lines".
  6. Add Another Visualization: Create a "Bar Chart".
    • Index Pattern: Same as above.
    • X-axis: Select "Terms" aggregation on `process.name`.
    • Y-axis: Metric: "Count".
    • Filters: Add a filter for `process.name: "powershell.exe"` to specifically focus on PowerShell.
  7. Save the Bar Chart: Name it "PowerShell Process Executions".
  8. Return to Dashboard: Add both saved visualizations to your dashboard. Adjust their size and position.
  9. Refine: You can add more visualizations, such as a pie chart showing command lines containing "encodedCommand" or "Invoke-", or a time-series chart showing the count of suspicious command lines over time.

This basic dashboard immediately gives you visibility into potentially malicious commands being executed on your endpoints, allowing for quick triage.

Frequently Asked Questions

Q1: What is the difference between Discover and Dashboard in Kibana?

Discover is for interactively querying and exploring raw data. Dashboards are collections of saved visualizations that provide a high-level overview and monitor trends over time.

Q2: Can Kibana ingest data directly?

No, Kibana is a visualization and exploration tool. Data is ingested and indexed into Elasticsearch by agents like Filebeat, Logstash, or Beats.

Q3: How do I optimize Kibana performance?

Performance optimization primarily involves tuning Elasticsearch performance (sharding, indexing, hardware provisioning), designing efficient index patterns, and creating optimized queries and visualizations. Keeping Kibana itself updated also helps.

Q4: Is Kibana suitable for real-time threat hunting?

Yes, when configured with appropriate data sources (like Filebeat with auto-refresh enabled) and an optimized Elasticsearch cluster, Kibana can provide near real-time visibility into security events.

Q5: What are some common threat hunting queries to start with in Kibana?

Look for command-line arguments containing obfuscation techniques (e.g., `encodedCommand`, `IEX`, `Invoke-Expression`), unusual process parent-child relationships, connections to known malicious IPs, or large outbound data transfers.

The Contract: Your Kibana Threat Hunt Challenge

The darkness is spreading. An alert just fired: "Unusual outbound network traffic detected from an internal workstation." Your task is to use Kibana (assume you have access to endpoint logs and network flow data indexed) to investigate this. Craft three distinct Kibana queries or visualization concepts that will help you determine if this is a genuine threat or a false positive. For each concept, briefly describe:

  1. The specific Kibana query (KQL) or visualization type you'd use.
  2. The fields you would target.
  3. What anomalies or patterns you would look for to indicate malicious activity.

Detail your findings below. Show me you can turn data into defense.

Mastering Intrusion Detection: A Deep Dive into Zeek and Elastic for Incident Response

The digital realm is a battlefield, and an effective intrusion detection system (IDS) is your frontline defense. In the shadowed alleys of cyberspace, understanding how these systems work isn't just a skill; it's survival. This isn't about theory; it's about dissecting the enemy's approach to build impregnable fortresses. Today, we're pulling back the curtain on intrusion detection, leveraging the power of Zeek (formerly Bro) and the analytical might of the Elastic Stack.

Intrusion detection is a cornerstone for any serious cybersecurity professional. It's the silent sentinel, the digital bloodhound sniffing out the faint scent of compromise. In this post, we'll transform the raw data from a live webcast into actionable intelligence, equipping you not just with knowledge, but with the tools to actively hunt threats. We’ll move beyond the superficial, diving deep into the mechanics of detection, incident response, and the career pathways it unlocks. Consider this your initiation into the elite ranks of threat hunters and incident responders.

Table of Contents

Intro and Agenda

The digital shadows lengthen, and the whispers of an intrusion become a deafening roar if you're not listening. This webcast isn't for the faint of heart. It's a deep dive for those who want to understand the anatomy of an attack by dissecting the data it leaves behind. We're armed with Zeek, the silent observer, and Elastic, the all-seeing eye, to build a robust incident response capability. Let's break down the agenda:

Intrusion Detection Training Resources

Before we dive into the trenches, let’s talk about the arsenal available. Continuous learning is paramount in this game. For those serious about elevating their skills, the Advanced Intrusion Detection learning path is your next logical step. Mark's blogs, found at https://ift.tt/82M4UtS, offer granular insights into the tactics and techniques that matter. Don't underestimate the power of a free account on Infosec Skills; it’s your gateway to hands-on practice. And for the truly ambitious, the monthly challenges and the Infosec Accelerate Scholarship program present opportunities to fast-track your career.

What is Intrusion Detection?

At its core, intrusion detection is the process of monitoring network or system activities for malicious activities or policy violations. It’s about identifying the "noise" that signifies something sinister. An IDS acts as the vigilant guard, flagging suspicious patterns that deviate from the norm, hinting at an adversary's footprint.

Who Should Learn Intrusion Detection?

This skill isn't confined to a single role. Security analysts, SOC operators, incident responders, threat hunters, penetration testers, and even system administrators responsible for secure environments all benefit. If you're tasked with protecting digital assets, understanding how to detect and respond to breaches is non-negotiable.

Main Intrusion Detection Tasks and Tools

The tasks involved range from passive monitoring and log analysis to active threat hunting and forensic investigation. The tools are as varied as the threats themselves. We will focus on:

  • Zeek: A powerful network analysis framework that transforms raw network traffic into high-level security metadata. It's not just an IDS; it’s a versatile security monitoring tool.
  • Elastic Stack (Elasticsearch, Logstash, Kibana): A robust platform for searching, analyzing, and visualizing log data. Kibana, in particular, transforms complex datasets into digestible dashboards and alerts.
  • Brim Security: A modern, open-source tool that simplifies the process of analyzing Zeek logs, making the data accessible for incident response.

Intrusion Detection Career Path and Roles

The path often starts in a Security Operations Center (SOC) as a Tier 1 analyst, triaging alerts. From there, specialization can lead to Tier 2/3 SOC analyst roles, incident response, forensic analysis, malware analysis, or threat intelligence. Each role demands a deep understanding of detection mechanisms.

3 Types of Intrusion Detection

Broadly, intrusion detection systems fall into three categories:

  1. Network Intrusion Detection Systems (NIDS): Monitor network traffic for suspicious patterns. They analyze packets traversing the network, looking for known attack signatures or anomalous behavior.
  2. Host Intrusion Detection Systems (HIDS): Monitor individual hosts (servers, workstations) for malicious activity. They analyze system logs, file integrity, and running processes.
  3. Hybrid Intrusion Detection Systems: Combine elements of both NIDS and HIDS to provide a more comprehensive view.

Intrusion Detection and the MITRE ATT&CK Matrix

Mapping your detection capabilities to the MITRE ATT&CK framework is a critical exercise. It helps identify gaps in your visibility and ensures your defenses are aligned with real-world adversary tactics, techniques, and procedures (TTPs). Zeek and Elastic, when properly configured, can provide telemetry for a significant portion of these TTPs.

Poll Question: Have You Used Intrusion Detection Tools?

During the webcast, a poll revealed that a significant majority of participants have utilized intrusion detection tools, underscoring their relevance. However, the learning curve and complexity remain challenges for many. This highlights the need for practical, hands-on training like what we're discussing today.

Intrusion Detection Demo Overview

The live demonstration focused on a practical scenario: responding to a potential security incident using Zeek logs and the Elastic Stack. The workflow involved capturing network traffic, processing it with Zeek, and then feeding the resulting logs into Elastic for analysis and visualization.

Intrusion Detection Scenario

Imagine receiving an alert about suspicious outbound traffic from a critical server. Is it legitimate communication, or has a host been compromised and is now exfiltrating data? This is where a well-configured IDS pipeline becomes invaluable.

Getting PCAP Files from Malware-Traffic-Analysis.net

For realistic incident response training, access to real-world network traffic is essential. Malware-Traffic-Analysis.net is an excellent resource for downloading PCAP (Packet Capture) files that simulate malicious network activity. These files are the raw ingredients for our analysis.

Using Brim to Turn PCAP Files into Zeek Logs

Raw PCAP files are dense and difficult to parse directly. This is where Zeek shines, and Brim makes using Zeek accessible. Brim securely processes PCAP files, generating structured Zeek logs. These logs are not just packet dumps; they are rich security metadata, distilling network conversations into actionable fields like connection details, protocol usage, and file transfers. Running Zeek through Brim allows us to convert those raw packets into a format that's much more amenable to analysis, turning noise into signal.


# Example: Using Brim CLI (conceptual)
brimcap --zkg Zeek --output-dir ./zeek_logs capture.pcap

Overview of Using Elastic for Incident Response

The Elastic Stack is our command center. Elasticsearch acts as the distributed search and analytics engine, capable of handling massive volumes of log data. Logstash (or Beats) is used for data ingestion and transformation, while Kibana provides the visualization layer. This trio allows us to ingest Zeek logs, index them for fast searching, and build dashboards to monitor our environment and hunt for threats.

Uploading CSV File from Brim to Elastic

After processing PCAP with Brim, you can export the Zeek logs in a structured format, such as CSV. This CSV can then be ingested into Elastic. While direct Zeek log ingestion is often preferred for richer data, CSV export provides a straightforward method to get the data into Elasticsearch for initial analysis or in environments where direct log parsing is challenging.


# Conceptual: Exporting from Brim and importing to Elasticsearch
# 1. Export from Brim: brimcap --export-csv <pcap_file> > zeek_logs.csv
# 2. Ingest into Elasticsearch using Filebeat or Logstash ingest pipeline

Types of Data to Ship to Elastic for Incident Response

Beyond network logs, a comprehensive incident response strategy requires ingesting various data sources:

  • Endpoint logs: Process execution, registry changes, file activity (e.g., from Elastic Agent or Auditbeat).
  • Authentication logs: Active Directory or other identity provider logs.
  • Firewall logs: Network traffic flow and policy enforcement.
  • Application logs: Web server logs, database logs, etc.
  • Cloud provider logs: AWS CloudTrail, Azure Activity Logs.

The more telemetry you have, the clearer the picture of an intrusion becomes.

Elastic Integrations for Azure and Cloud Services

Elastic offers robust integrations for major cloud platforms like Azure and AWS. These integrations, often managed via Elastic Agent, streamline the collection of cloud-specific logs, such as Azure Activity Logs or AWS CloudTrail events. This allows you to maintain a unified view of your on-premises and cloud environments within a single Elastic instance.

Exploring the Data and Log Files in Elastic

Kibana's Discover tab is your primary interface for exploring raw log data. You can filter by time, search for specific keywords, and inspect individual log entries. Understanding the schema of Zeek logs (e.g., `conn.log`, `http.log`, `dns.log`) is crucial for effective querying. For example, to find suspicious DNS requests:


# KQL query in Kibana Discover
_index: "zeek-logs-*" AND dns.query:"*.ru"

Types of Zeek Log Records

Zeek generates a multitude of log types, each providing a different lens into network activity:

  • Conn.log: Connection logs detailing TCP, UDP, and ICMP connections.
  • Http.log: HTTP transaction logs, including URLs, methods, user agents, and response codes.
  • Dns.log: DNS query and response records.
  • Ssl.log: SSL/TLS certificate and connection details.
  • Files.log: Records of files transferred over the network, with hashing information.
  • Email.log: SMTP transaction details.

Mastering these logs is key to understanding network behavior.

Using Elastic Dashboards for Incident Response

Static log exploration can only go so far. Elastic Dashboards transform raw data into dynamic visualizations. Pre-built dashboards for Zeek logs can provide immediate insights into network traffic volume, top talkers, protocol distribution, and potential anomalies. You can customize these or build your own to focus on specific threats.

Using Elastic Rules for Detections and Alerts

Detection Engineering is where proactive defense truly happens. Elastic Security provides a framework for creating detection rules. These rules can be signature-based (looking for specific patterns in logs), threshold-based (triggering when metrics exceed a certain level), or even machine learning-based. When a rule triggers, it generates an alert, which can then be investigated within Kibana's Case Management or integrated with ticketing systems.


// Example of a simple Elastic Rule (conceptual)
{
  "name": "Suspicious Outbound HTTP",
  "type": "machine_learning",
  "index": "zeek-logs-*",
  "query": { "term": { "event.category": "network" } },
  "threshold": 10,
  "anomaly_threshold": 20,
  "machine_learning_job_id": "..."
}

Integrating Open-Source Threat Intelligence into Elastic

Augmenting your detection capabilities with open-source threat intelligence feeds is a force multiplier. Tools like MISP (Malware Information Sharing Platform) can be used to aggregate IOCs (Indicators of Compromise) like malicious IPs, domains, or hashes. Elastic Security can ingest these IOCs and correlate them against your ingested data, automatically flagging potentially malicious activity.

Hands-On Training and Certifications for Elastic

While this post provides a conceptual overview, true mastery requires hands-on practice. For those looking to formalize their expertise, certifications like the Elastic Certified Engineer are invaluable. Additionally, platforms like Infosec Skills offer practical labs using Elastic, preparing you for real-world incident response scenarios.

Sample Logs for Elastic Elasticsearch

When experimenting, having representative logs is crucial. Beyond the PCAP files from malware-traffic-analysis.net, consider generating your own synthetic logs mimicking common attacks or simply capturing normal traffic to establish a baseline. Elastic's documentation and community forums are excellent resources for finding sample datasets.

Filtering Relevant Data with Zeek and Elastic

The sheer volume of data can be overwhelming. Zeek, with its extensive scripting capabilities, can pre-filter and enrich logs, reducing the data volume sent to Elastic. Within Elastic, precise KQL (Kibana Query Language) or Elasticsearch Query DSL queries are essential for narrowing down investigations. For instance, filtering for only `http.log` entries from a suspicious IP:


_index: "zeek-logs-*" AND http.status_code >= 400 AND src_ip:"192.168.1.100"

What to Do After Setting Up Intrusion Detection Tools

Deployment is just the first step. The real work is in tuning your rules, establishing baselines, practicing incident response playbooks, and continuously reviewing your telemetry. Alert fatigue is real; diligent tuning is the only remedy. Regularly assess your detection coverage against emerging threats.

Progress on Alert Fatigue

The industry is actively working on reducing alert fatigue through better correlation, risk-based alerting, and machine learning models that prioritize genuine threats. However, skilled analysts who can effectively tune systems and investigate alerts remain indispensable. Tools like Elastic's SIEM capabilities are designed to help manage this, but human expertise is the final layer.

Setting Up Machine Learning Rules in Elastic

Elastic's Machine Learning features can detect anomalies that signature-based rules might miss. This involves training models on your data to identify deviations from normal behavior. For example, unusual login patterns, unexpected data transfer volumes, or new process executions on a host can be flagged by ML jobs.

Presenting Elastic Data to Management

Management doesn't need raw logs; they need answers. Translate your findings into business impact. Use clear, concise dashboards that highlight key metrics: number of incidents, average time to detect, types of threats, and the business risk associated with them. Focus on trends and actionable insights, not technical minutiae.

Advice for Getting Started in Intrusion Detection

Start small. Get comfortable with one tool, like Zeek, and a visualization platform, like Kibana. Practice with publicly available PCAP files. Understand your network baseline. Learn to ask the right questions of your data. And never stop learning; the threat landscape is constantly evolving.

Infosec Accelerate Scholarship Program

For individuals passionate about cybersecurity but facing financial barriers, the Infosec Accelerate Scholarship Program offers a pathway to critical training and certifications. It’s a program designed to cultivate the next generation of cyber defenders.

Infosec Skills On-Demand Training and Live Boot Camps

Whether you prefer to learn at your own pace or thrive in live, instructor-led environments, Infosec Skills offers a comprehensive suite of resources. Their on-demand courses and boot camps cover a vast range of cybersecurity topics, including deep dives into tools like Zeek and Elastic.

Veredicto del Ingeniero: ¿Vale la pena adoptar Zeek y Elastic?

Adopting Zeek and the Elastic Stack for intrusion detection and incident response is not just recommended; it's becoming a de facto standard for organizations serious about their security posture. Zeek's ability to generate rich, high-level metadata from network traffic is unparalleled. It provides context that raw packet captures lack, enabling faster analysis. Elastic, on the other hand, offers a scalable, powerful platform for ingesting, storing, searching, and visualizing this data. While the initial setup and tuning can be complex, the long-term benefits in terms of threat detection, hunting capabilities, and efficient incident response are immense. For any team looking to mature their security operations, this combination is a critical investment in their defensive infrastructure. Ignoring these tools is akin to sending your soldiers into battle unarmed.

Arsenal del Operador/Analista

  • Network Traffic Analysis Tool: Zeek (with Brim for log processing)
  • SIEM/Log Analytics Platform: Elastic Stack (Elasticsearch, Logstash/Beats, Kibana)
  • Data Sources: Network PCAPs, Endpoint Logs (Elastic Agent), Firewall Logs, Cloud Logs
  • Recommended Learning: Infosec Skills platform, advanced IDS courses, MITRE ATT&CK framework
  • Key Resource: Malware-Traffic-Analysis.net for PCAP samples
  • Threat Intelligence Integration: MISP, Open Source IOC feeds
  • Essential Certifications: Elastic Certified Engineer, GIAC certifications (GCIA, GCIH)
  • Essential Reading: "The Practice of Network Security Monitoring" by Richard Bejtlich, Zeek documentation

Taller Práctico: Fortaleciendo tu Detección con Reglas en Elastic

  1. Objetivo: Implementar una regla básica en Elastic para detectar comunicaciones sospechosas a dominios de alto riesgo.
  2. Requisito: Tener datos de Zeek (`dns.log`) indexados en Elasticsearch y Kibana accesible.
  3. Paso 1: Identificar una Fuente de IOCs. Utiliza una lista de dominios maliciosos conocidos. Para este ejemplo, asumiremos una lista simple. En un escenario real, integrarías un feed de threat intelligence.
  4. Paso 2: Crear un Índice de IOCs en Elasticsearch. Puedes crear un índice separado para tus dominios maliciosos. Por ejemplo, `malicious_domains` con un campo `domain_name`.
  5. Paso 3: Crear una Regla de Detección Correlacionada. En Kibana, ve a "Security" -> "Rules" y crea una nueva regla.
  6. Paso 4: Configurar la Condición de la Regla.
    • Tipo de Regla: Correlación (si estás cruzando dos fuentes de datos, o un KPI simple si solo buscas en logs Zeek).
    • Source: `dns.log` (o tu índice de logs Zeek).
    • Condition: El `dns.query` del log Zeek debe coincidir con alguno de los `domain_name` en tu índice `malicious_domains`.
    • Query DSL para la condición (ejemplo):
    
    {
      "bool": {
        "must": [
          { "term": { "event.category": "dns" } },
          {
            "terms": {
              "dns.query": [
                "malicious-domain1.ru",
                "suspicious-site.xyz",
                "phishing.com"
              ]
            }
          }
        ]
      }
    }
        
  7. Paso 5: Definir el Umbral y la Frecuencia. Establece cuántas veces debe ocurrir el evento patrocinador para generar una alerta (ej: 1 vez). Define la frecuencia de ejecución de la regla.
  8. Paso 6: Configurar la Acción de Alerta. Define qué sucede cuando la regla se dispara: generar un ticket, enviar un webhook, notificar en Slack, etc.
  9. Paso 7: Guardar y Habilitar la Regla. Asigna un nombre descriptivo, como "HighRisk-DNS-Query-Detected".
  10. Paso 8: Testear. Simula la visita a uno de los dominios maliciosos (en un entorno controlado) y verifica si la alerta se genera correctamente en Kibana.

Preguntas Frecuentes

¿Puedo usar Zeek y Elastic de forma gratuita?

Sí. Zeek es de código abierto. El Elastic Stack ofrece una versión gratuita (Basic) con funcionalidades significativas para logging y SIEM, aunque algunas características avanzadas requieren licencias de pago.

¿Qué tan preciso es Zeek en la detección de intrusiones?

Zeek no es un IDS tradicional basado en firmas. Genera metadatos ricos de la red. Su precisión radica en la capacidad de los analistas para usar estos metadatos y crear reglas o hunts que detecten anomalías y TTPs de atacantes. Es una herramienta de monitoreo de red de alto nivel.

¿Cuánto tiempo se tarda en configurar Zeek y Elastic?

La configuración básica puede tomar unas pocas horas. Sin embargo, optimizar Zeek para tu red, configurar Elastic para un volumen de datos masivo, y desarrollar reglas de detección efectivas puede llevar semanas o meses de trabajo continuo y ajuste.

¿Es posible integrar Zeek y Elastic con otras herramientas de seguridad?

Absolutamente. Elastic tiene APIs robustas que permiten la integración con sistemas de ticketing, plataformas de threat intelligence, y otras herramientas SOAR (Security Orchestration, Automation, and Response).

¿Reemplaza esta solución a un firewall tradicional?

No. Zeek y Elastic son herramientas de detección y respuesta. Un firewall es una herramienta de prevención de acceso. Trabajan de forma complementaria dentro de una estrategia de seguridad multicapa.

El Contrato: Fortalece tu Perímetro Digital

La defensa es un arte que se perfecciona con la práctica y la inteligencia. Has visto cómo Zeek destila el caos de la red en datos comprensibles, y cómo Elastic transforma esos datos en conocimiento accionable. Ahora, el contrato es tuyo: implementa una versión de este flujo de trabajo. Comienza con la descarga de un PCAP de malware-traffic-analysis.net, procesa esos logs con Zeek (puedes usar la línea de comandos o una herramienta como Brim), y luego intenta cargarlos en una instancia de Elasticsearch/Kibana (incluso las versiones gratuitas o Docker te servirán para empezar). Crea un dashboard simple para visualizar las conexiones HTTP o DNS. El objetivo no es la perfección, sino el dominio gradual. Cada paquete analizado, cada log correlacionado, es un paso para asegurar el perímetro digital.

Deep Dive: Threat Hunting with the ELK Stack - A Defensive Blueprint

The digital realm is a graveyard of forgotten vulnerabilities and exploited misconfigurations. In this labyrinth of ones and zeros, silence often screams louder than noise. Threat actors thrive in the shadows, moving with the stealth of a phantom limb. Your mission, should you choose to accept it, is not to chase ghosts, but to understand their footprints. Today, we strip down the mechanics of proactive defense, dissecting the ELK Stack – Elasticsearch, Logstash, Kibana – augmented by Beats, as our weapon of choice for advanced threat hunting.

This isn't about simply collecting logs; it's about building an intelligent surveillance system, a digital nervous system that can detect the faintest tremor of malicious intent before it becomes a catastrophic breach. We’re not just patching holes; we’re fortifying the walls based on an intimate understanding of the enemy's methods. Let’s turn passive observation into active intel.

Table of Contents

Introduction: The Art of Proactive Defense

In the perpetual cat-and-mouse game of cybersecurity, waiting for an alert is a losing strategy. True security professionals don't react; they anticipate. Threat hunting is the embodiment of this proactive stance – the deliberate, iterative search through networks and systems for undetected threats. It’s about assuming compromise and hunting for the evidence. The ELK Stack, a powerful open-source suite, coupled with the lightweight Beats data shippers, provides the foundational tools for such an endeavor. This isn't about magic; it's about methodical investigation, transforming raw log data into actionable intelligence.

Consider this your field manual. We’ll break down the architecture, the methodology, and the practical application of ELK for hunting down adversaries who think they're invisible.

ELK Stack Overview: The Core Components

The ELK Stack is a synergy of three robust open-source projects, each playing a crucial role in the data lifecycle from ingestion to visualization:

  • Elasticsearch: At its heart, Elasticsearch is a distributed search and analytics engine. It excels at indexing, searching, and analyzing large volumes of data in near real-time. Think of it as the secure vault where all your intel is stored and readily accessible. Its RESTful API makes it highly programmable and integrable into complex security workflows.
  • Logstash: This is the data processing pipeline. Logstash ingests data from myriad sources, transforms it (parsing, filtering, enriching), and then outputs it to a storage backend, in our case, Elasticsearch. It’s the meticulous archivist, ensuring data is clean, structured, and ready for analysis.
  • Kibana: The visualization layer. Kibana provides a web interface to explore, visualize, and dashboard your Elasticsearch data. It allows security analysts to craft queries, build dynamic charts, and create comprehensive dashboards that paint a clear picture of the network's health and any anomalies. It’s the detective's magnifying glass and corkboard, connecting the dots.

Beats: The Eyes and Ears on the Ground

While ELK forms the core, Beats are the lightweight, single-purpose data shippers that collect and forward data to Logstash or directly to Elasticsearch. They are designed to be efficient and resource-light:

  • Filebeat: Tails log files and forwards them. Essential for capturing application logs, system logs, and any file-based data.
  • Metricbeat: Collects system-level and service-related metrics. Think CPU, memory, disk I/O, and statistics from services like Nginx, Apache, or databases.
  • Packetbeat: Monitors network traffic in real-time, inspecting raw network packets and extracting vital information about your network communications.
  • Winlogbeat: Specifically for Windows, it collects security event logs, including login/logout events, process creation, and more.
  • Auditbeat: Collects audit data and enforces integrity monitoring on filesystems.

The strategic deployment of these Beats across your infrastructure ensures comprehensive data visibility, forming the bedrock of any effective threat hunting operation.

The Threat Hunting Methodology

Threat hunting is not a random act. It’s a disciplined process, often iterative, that can be broken down into key phases:

  1. Hypothesis Formulation: Start with a suspicion. What could an attacker be doing? What indicators would that leave?
  2. Data Collection: Identify and collect the relevant data sources (logs, network traffic, endpoint telemetry) that would support or refute your hypothesis.
  3. Data Analysis: Utilize tools like ELK to examine the collected data. Look for anomalies, deviations from baseline, and known malicious patterns (Indicators of Compromise - IoCs).
  4. Discovery and Investigation: If potential threats are found, dive deeper. Correlate events, trace activity, and gather evidence.
  5. Response and Remediation: Once a threat is confirmed, initiate incident response procedures to contain, eradicate, and recover.
  6. Feedback and Refinement: Use the findings to improve your defenses, update hunting hypotheses, and enhance data collection.

This cycle is continuous. The digital battleground is dynamic, and so must be your hunting strategy.

Hypothesis-Driven Hunting: Formulating Your Attack Vectors

Randomly sifting through logs is like searching for a needle in a haystack blindfolded. A hypothesis provides direction. It’s a educated guess about potential attacker behavior tailored to your environment. Think like an adversary:

  • Lateral Movement: "An attacker has gained initial access and is attempting to move to other systems. I'll hunt for unusual RDP or SMB connections from workstations to servers, or suspicious PowerShell remoting activity."
  • Data Exfiltration: "An insider or compromised account is trying to steal data. I'll hunt for large outbound data transfers from unexpected sources, or access patterns to sensitive file shares outside normal working hours."
  • Persistence: "An attacker has established a foothold and is trying to maintain access. I'll hunt for new scheduled tasks, unusual registry modifications in startup keys, or the creation of hidden services."
  • Credential Harvesting: "An attacker is trying to steal credentials. I'll hunt for multiple failed login attempts followed by a success on a single account, NTLM relay attacks, or suspicious usage of `Mimikatz` or similar tools on endpoints."

Each hypothesis translates into specific data points, query patterns, and analytical techniques. Your ELK stack becomes the forensic lab for validating these suspicions.

Data Ingestion and Enrichment with Logstash

Logstash is the workhorse of your data pipeline. It's where raw, disparate logs are transformed into a structured, queryable format.

A typical Logstash configuration involves three sections: input, filter, and output.

Example Filter Configuration: Parsing Windows Event Logs

filter {
  if [type] == "wineventlog" {
    grok {
      match => { "message" => "%{GREEDYDATA:winevent_data}" }
    }
    # Example: Parse specific events like process creation (Event ID 4688)
    if [event_id] == 4688 {
      grok {
        match => { "winevent_data" => "A new process has been created.\n\nSubject:\n\tAccount Name:\t%{DATA:subject_account_name}\n\nNew Process:\n\tNew Process Name:\t%{DATA:process_name}\n\tCommand Line:\t%{GREEDYDATA:process_command_line}" }
      }
      mutate {
        remove_field => ["winevent_data"]
      }
    }
    # GeoIP enrichment for network events
    if [client.ip] {
      geoip {
        source => "client.ip"
      }
    }
  }
}

Enrichment: Logstash can enrich your data with contextual information. For instance, if you're processing network logs with client IP addresses, you can use the geoip filter to add geographical location data. For security events, you might use a dictionary filter to map internal IP addresses to hostnames or asset criticality, transforming raw IPs into meaningful context for hunting.

Leveraging Elasticsearch for Deep Analysis

Once data lands in Elasticsearch, its true power for threat hunting emerges. Elasticsearch’s query DSL (Domain Specific Language) allows for complex searches, aggregations, and pattern detection.

Key Concepts for Hunting:

  • Index Patterns: Define how Kibana interacts with your Elasticsearch indices. For time-series data like logs, you'll typically use index templates with date-based indices (e.g., filebeat-7.x.x-YYYY.MM.DD).
  • Query DSL: The foundation of searches. You can construct queries using both a JSON-based DSL and a simpler Query String syntax.
  • Aggregations: Powerful tools to summarize data, such as finding the top N IP addresses, counting events by type, or calculating statistical distributions.
  • KQL (Kibana Query Language): A user-friendly syntax for Kibana searches, allowing quick filtering and exploration.

Hunting involves crafting queries that deviate from the norm. For example, looking for processes running from unusual directories, or detecting authentication attempts from geographically improbable locations.

Kibana: Visualizing the Threat Landscape

Kibana transforms your raw data and complex Elasticsearch queries into human-readable insights. It’s where you’ll spend much of your time during a hunt.

  • Discover: The primary interface for ad-hoc searching and data exploration. You can filter, view raw logs, and build initial queries here.
  • Visualize: Create charts, graphs, maps, and other visualizations based on Elasticsearch data using aggregations.
  • Dashboard: Assemble your visualizations into comprehensive dashboards. A well-designed dashboard can provide an immediate overview of your security posture and highlight potential threats.
  • Machine Learning (Commercial Feature): For advanced anomaly detection, Elasticsearch's ML features can automatically identify unusual patterns in your data that might indicate threats.

For threat hunting, you'll create dashboards monitoring key security indicators: authentication failures, suspicious process executions, unusual network connections, and deviations from established baselines.

Practical Hunting Scenarios and Queries

Let's get hands-on. Here are a few hypotheses and corresponding query concepts:

Hypothesis: A user is running PowerShell scripts from an unusual location or with suspicious parameters, indicating potential malicious scripting.

Kibana Query (KQL):

process.name : "powershell.exe" and (process.command_line : "*encodedCommand*" or process.command_line : "*-w hidden*")

This query looks for powershell.exe processes where the command line indicates encoded commands or hidden windows – common tactics for obfuscating malicious scripts.

Hypothesis: An attacker is attempting to access sensitive shares using default or weak credentials.

Kibana Query (KQL):

event.action : "access_shared_folder" and user.name : ("Administrator", "guest", "root")

This could be adapted for various log sources (e.g., SMB logs, Windows Security Event IDs) to catch attempts to access resources with highly privileged or default accounts.

Hypothesis: Suspicious network connections from internal hosts to known malicious IPs or unusual ports.

Kibana Query (KQL):

event.category : "network" and destination.ip : (lookup_ip_list_of_bad_ips) and destination.port != (80, 443, 22)

This requires maintaining a curated list of known bad IPs or observing connections to non-standard ports from internal assets.

Advanced Techniques and Considerations

  • Data Normalization: Standardizing log formats across different sources is crucial for effective querying. Elastic Common Schema (ECS) is highly recommended.
  • Baselining: Understand what "normal" looks like in your environment. This allows you to more easily spot deviations.
  • Threat Intelligence Integration: Feed threat intelligence feeds (lists of malicious IPs, domains, hashes) into Logstash or Elasticsearch to automatically flag suspicious activity.
  • Tuning Alerts: Once hunting, you'll find patterns that warrant automated alerting. Tune these carefully to minimize false positives.
  • Performance Optimization: For very large datasets, optimize Elasticsearch cluster performance through proper indexing strategies, shard management, and hardware allocation.
  • Security of ELK Deployment: Treat your ELK stack as a critical security asset. Ensure it's hardened, monitored, and access-controlled.

Verdict of the Engineer: Is ELK Prime for Your Defense?

The ELK Stack, especially when combined with Beats, is a powerhouse for centralized logging, analysis, and threat hunting. Its open-source nature makes it accessible, while its scalability and flexibility make it suitable for environments ranging from small businesses to large enterprises.

Pros:

  • Powerful search and analysis capabilities.
  • Flexible data ingestion and transformation.
  • Rich visualization and dashboarding.
  • Large, active open-source community.
  • Scalable architecture.
  • Excellent for anomaly detection and hypothesis-driven hunting.

Cons:

  • Can be resource-intensive to operate and scale effectively.
  • Requires significant expertise to configure, tune, and maintain for optimal performance and security.
  • Some advanced features (like robust ML anomaly detection or advanced security hardening) are part of the commercial Elastic Stack subscriptions.
  • Requires a strong understanding of data formats, query languages, and threat actor methodologies.

Decision: For organizations serious about moving beyond reactive security to proactive threat hunting, the ELK Stack is an indispensable tool. It provides the visibility needed to detect the subtle signs of compromise. However, it's not a set-and-forget solution. It demands skilled operators, continuous tuning, and a commitment to defensive strategy.

Arsenal of the Operator/Analyst

  • Software:
    • Elastic Stack (ELK + Beats): The core platform.
    • Wireshark/Tshark: For deep packet inspection when network telemetry raises flags.
    • Sysinternals Suite: Essential for endpoint analysis and investigation.
    • CyberChef: The "Swiss Army knife" for decoding/encoding data encountered during hunts.
  • Hardware:
    • A robust server infrastructure or cloud resources capable of handling the ELK cluster's demands.
  • Books:
    • "The ELK Stack in Action"
    • "Gray Hat Hacking: The Ethical Hacker's Handbook"
    • "Hands-On Network Forensics and Penetration Testing"
  • Certifications:
    • Consider Elastic Certified Engineer.
    • For broader security skills: OSCP, CISSP, GIAC certifications.

Defensive Workshop: Detecting Lateral Movement

Lateral movement is a critical phase for attackers. Detecting it early can shut down an entire campaign. Let's focus on detecting RDP/SSH brute-force or abuse.

Objective: Identify suspicious login patterns indicative of an attacker trying to gain access to multiple internal systems.

Data Sources Required:

  • Windows Security Event Logs (Event ID 4624 for successful logins, 4625 for failed logins, 4648 for explicit credential usage).
  • Linux Secure Logs (auth.log or equivalent) for SSH login attempts.
  • Network logs (Packetbeat or firewall logs) for RDP (3389) or SSH (22) connections.

Steps for Hunting:

  1. Establish Baselines: What are the typical login times and sources for your key servers and user accounts?
  2. Hunt for Brute Force: Query for multiple failed login attempts (Event ID 4625 / SSH auth failures) from a single source IP to multiple destination IPs or accounts within a short timeframe.
  3. Example KQL for Windows:

    event.code : 4625 and _exists_: "user.name" and _exists_: "source.ip"
            

    Then, aggregate by source.ip and count distinct user.name and occurrences within a rolling time window.

  4. Hunt for Account Sweeping: Query for successful logins (Event ID 4624 / SSH success) for highly privileged accounts (e.g., Domain Admins, root) from unusual source IPs or at unusual times.
  5. Example KQL for Windows:

    event.code : 4624 and user.name : "Administrator" and NOT source.ip : (trusted_admin_workstations_cidr)
            
  6. Hunt for Explicit Credential Usage: Look for Event ID 4648 on Windows, which signifies a logon attempt using explicit credentials. This is often used by tools like PsExec or Mimikatz. Correlate this with process creation logs for these tools.
  7. Network Correlation: Use network data to see if the source IPs identified in login events are also initiating RDP/SSH connections.

Frequently Asked Questions

Q1: How much data can ELK handle?
A: Elasticsearch is designed for massive scalability. Its performance depends heavily on hardware, indexing strategy, cluster configuration, and the volume/complexity of data. It can scale to petabytes of data.

Q2: Is ELK difficult to set up?
A: Basic setup can be straightforward, especially with pre-built distributions or Docker. However, optimizing for production, security hardening, and scaling requires significant expertise and ongoing effort.

Q3: Can I use ELK for real-time alerting?
A: Yes. Kibana has alerting features (X-Pack alerting, or custom solutions using Elasticsearch's Watcher API) that can trigger notifications based on detected patterns or anomalies.

Q4: What's the difference between Logstash and Beats?
A: Beats are lightweight shippers for collecting specific types of data. Logstash is a more powerful, general-purpose data processing pipeline that can ingest from various sources (including Beats), transform, filter, and output data.

Q5: How do I protect my ELK cluster itself?
A: Implement strong authentication and authorization, encrypt data in transit (TLS/SSL), restrict network access to the cluster, regularly patch all components, and monitor the cluster's own logs for suspicious activity.

The Contract: Your First Threat Hunt Challenge

You've seen the blueprint. Now, it's time to execute. Your contract is to devise and articulate a threat hunting hypothesis for detecting the presence of known Cobalt Strike beacons within your network, assuming you have access to network traffic logs (via Packetbeat) and endpoint process execution logs (via Filebeat/Winlogbeat).

For each hypothesis:

  1. Clearly state the hypothesis.
  2. Identify the specific fields and data points you would look for in your logs.
  3. Provide example Kibana Query Language (KQL) snippets or Elasticsearch DSL queries that could help detect this activity.

Don't just collect logs; hunt with purpose. The shadows are vast, but with the right tools and a sharp mind, no adversary is truly invisible.

Guía Definitiva: Montando ELK Stack para Cyber Threat Hunting Avanzado

La luz parpadeante del monitor era la única compañía mientras los logs del servidor escupían una anomalía. Una que no debería estar ahí. En este submundo digital, las amenazas no anuncian su llegada, se deslizan por las grietas, susurran en el silencio de los sistemas inatentos. Hoy no vamos a parchear un sistema, vamos a construir el puesto de avanzada, la sala de control desde donde cazaremos a esos fantasmas en la máquina. Hablamos de la infraestructura esencial para cualquier operación de Threat Hunting: el ELK Stack.

Este conjunto de herramientas, comúnmente conocido como ELK (Elasticsearch, Logstash, Kibana), es la columna vertebral para recopilar, analizar y visualizar grandes volúmenes de datos de seguridad. Si tu objetivo es detectar y responder a incidentes de forma proactiva, entonces dominar el montaje y la configuración de ELK no es una opción, es una necesidad cruda. Este no es un tutorial para principiantes que buscan evitar el trabajo; esto es para aquellos que están listos para ensuciarse las manos y construir su propio campo de batalla digital.

Tabla de Contenidos

¿Por qué ELK para Threat Hunting?

En la guerra digital, la inteligencia es tu mejor arma. El Threat Hunting no es sobre reaccionar a alertas predefinidas; es sobre la búsqueda activa de amenazas que han logrado evadir los controles de seguridad tradicionales. Necesitas visibilidad. Necesitas la capacidad de correlacionar eventos que, individualmente, parecen inofensivos, pero que juntos pintan un cuadro aterrador de compromiso. Aquí es donde ELK brilla.

Mientras que otras soluciones pueden ofrecer alertas puntuales, ELK te da el lienzo crudo. Elasticsearch almacena y indexa tus logs a una velocidad vertiginosa, Logstash actua como tu agente de inteligencia en el campo, recolectando y transformando datos crudos en información procesable, y Kibana te proporciona una interfaz para visualizar patrones, identificar anomalías y contar la historia de lo que realmente está sucediendo en tu red.

"La información es poder. La información mal organizada es ruido." - Un hacker anónimo que perdió su acceso por no saber leer sus propios logs.

Ignorar la recopilación y el análisis de logs es como navegar a ciegas en un campo minado. Necesitas una herramienta que convierta el ruido de miles de eventos diarios en datos significativos. Para un operador de seguridad, construir y mantener un entorno ELK robusto es tan fundamental como tener un buen endpoint protection. Es la base sobre la que construyes tu capacidad de detección y respuesta.

Desglosando el ELK Stack: Roles y Funciones

Antes de empezar a teclear comandos, entendamos la arquitectura de este sistema. Simplificado, cada componente cumple un rol crítico en la cadena de procesamiento de la inteligencia:

  • Elasticsearch (E): Piensa en Elasticsearch como el cerebro de análisis. Es un motor de búsqueda y análisis distribuido, basado en Apache Lucene. Su principal fortaleza es la capacidad de indexar y buscar grandes volúmenes de datos JSON de manera rápida y escalable. Para el threat hunting, esto significa poder hacer consultas complejas sobre terabytes de logs en cuestión de segundos.
  • Logstash (L): Logstash es el agente de campo, el recolector de inteligencia. Es un pipeline de procesamiento de datos del lado del servidor que ingiere datos de múltiples fuentes simultáneamente, los transforma (filtrando, analizando, enriqueciendo) y luego los envía a un "stash" de tu elección, que en nuestro caso será Elasticsearch. Puede manejar logs de firewalls, servidores web, aplicaciones, sistemas operativos, y prácticamente cualquier cosa que genere eventos.
  • Kibana (K): Kibana es tu centro de mando visual. Es la interfaz de usuario para Elasticsearch. Te permite explorar tus datos indexados, crear visualizaciones (gráficos, mapas, tablas), y construir dashboards interactivos. Para un cazador de amenazas, Kibana transforma la abstracción de los datos crudos en patrones visibles, permitiendo identificar comportamientos anómalos que de otra manera pasarían desapercibidos.

La sinergia entre estos tres componentes crea un sistema poderoso para la observabilidad y la seguridad. Sin embargo, el verdadero valor no reside en el software en sí, sino en cómo lo configuras y utilizas como parte de una estrategia de threat hunting bien definida.

Taller Práctico: Montando tu Máquina Hunter con ELK

Ahora, la parte que realmente importa: construir la maquinaria. Este tutorial te guiará a través del montaje de un entorno ELK funcional en una máquina dedicada (o una VM robusta). Asumo que tienes conocimientos básicos de administración de sistemas Linux y manejo de la terminal.

Nota Importante: Para un entorno de producción real, se recomienda desplegar ELK en un cluster distribuido para alta disponibilidad y escalabilidad. Este montaje es ideal para aprendizaje, pruebas o entornos de laboratorio.

Paso 1: Preparación del Terreno (Sistema Operativo y Requisitos)

Necesitarás un sistema operativo Linux (recomendamos Ubuntu Server LTS o Debian). Asegúrate de tener suficiente RAM (mínimo 8GB, idealmente 16GB o más para producción) y espacio en disco. También es crucial instalar Java Development Kit (JDK), ya que Elasticsearch y Logstash lo requieren.

Asegúrate de que tu sistema esté actualizado:

sudo apt update && sudo apt upgrade -y

Instala el JDK (OpenJDK es una opción sólida):

sudo apt install openjdk-17-jdk -y

Verifica la instalación de Java:

java -version

Es fundamental configurar `limits.conf` para permitir que Elasticsearch maneje más archivos abiertos y memoria virtual. Añade estas líneas al final de `/etc/security/limits.conf`:


  • soft nofile 65536
  • hard nofile 65536
root soft nofile 65536 root hard nofile 65536
  • soft nproc 2048
  • hard nproc 2048
root soft nproc 2048 root hard nproc 2048

Y en `/etc/sysctl.conf` para aumentar el límite de memoria virtual:


vm.max_map_count=262144

Aplica los cambios de `sysctl`:

sudo sysctl -p

Paso 2: Instalando Elasticsearch - El Cerebro

Elasticsearch se puede instalar añadiendo su repositorio oficial. Primero, instala las dependencias necesarias:

sudo apt install apt-transport-https curl gnupg -y

Añade la clave GPG de Elastic:

curl -fsSL https://artifacts.elastic.co/GPG-KEY-elasticsearch | sudo gpg --dearmor -o /usr/share/keyrings/elasticsearch-keyring.gpg

Añade el repositorio de Elastic:

echo "deb [signed-by=/usr/share/keyrings/elasticsearch-keyring.gpg] https://artifacts.elastic.co/packages/8.x/apt stable main" | sudo tee /etc/apt/sources.list.d/elastic-8.x.list

Actualiza la lista de paquetes e instala Elasticsearch:

sudo apt update && sudo apt install elasticsearch -y

Habilita y inicia el servicio de Elasticsearch:

sudo systemctl daemon-reload
sudo systemctl enable elasticsearch.service
sudo systemctl start elasticsearch.service

Verifica que Elasticsearch esté corriendo:

sudo systemctl status elasticsearch.service

Espera a que el servicio se inicie completamente y luego prueba a consultarlo:

curl -X GET "localhost:9200"

Deberías obtener una respuesta JSON con detalles de tu nodo Elasticsearch. Si no está accesible, revisa los logs (`/var/log/elasticsearch/`) y la configuración en `/etc/elasticsearch/elasticsearch.yml`.

Paso 3: Configurando Logstash - El Recolector Implacable

Continuamos con Logstash. Usa los mismos repositorios que para Elasticsearch para instalar su última versión:

sudo apt update && sudo apt install logstash -y

Logstash se configura mediante archivos de configuración. Crearemos un archivo para definir la entrada, el filtro y la salida de nuestros datos. Por ejemplo, para recibir logs de Syslog y enviarlos a Elasticsearch:

Crea un archivo de configuración en `/etc/logstash/conf.d/`, por ejemplo, `syslog.conf`:

sudo nano /etc/logstash/conf.d/syslog.conf

Pega la siguiente configuración básica:

input {
  syslog {
    port => 5454
    type => "syslog"
  }
}
filter {
  if [type] == "syslog" {
    grok {
      match => { "message" => "%{SYSLOGTIMESTAMP:syslog_timestamp} %{SYSLOGHOST:syslog_hostname} %{DATA:syslog_program}(?:[%{NUMBER:syslog_pid}])?: %{GREEDYDATA:syslog_message}" }
    }
    date {
      match => [ "syslog_timestamp", "MMM  d HH:mm:ss", "MMM dd HH:mm:ss" ]
    }
  }
}
output {
  elasticsearch {
    hosts => ["localhost:9200"]
    index => "logstash-%{type}-%{+YYYY.MM.dd}"
  }
}

Guarda y cierra el archivo (Ctrl+X, Y, Enter). Ahora, habilita e inicia el servicio de Logstash:

sudo systemctl daemon-reload
sudo systemctl enable logstash.service
sudo systemctl start logstash.service

Verifica el estado y los logs de Logstash si encuentras problemas.

Paso 4: Desplegando Kibana - La Ventana al Caos

Kibana es la interfaz gráfica que nos permitirá interactuar con Elasticsearch. Se instala de manera similar a los componentes anteriores:

sudo apt update && sudo apt install kibana -y

La configuración principal de Kibana se encuentra en `/etc/kibana/kibana.yml`. Asegúrate de que la siguiente línea esté descomentada y configurada correctamente (si no, añádela):

server.port: 5601
elasticsearch.hosts: ["http://localhost:9200"]

Si planeas acceder a Kibana desde otra máquina, también descomenta y configura `server.host`:

server.host: "0.0.0.0"

Habilita e inicia Kibana:

sudo systemctl daemon-reload
sudo systemctl enable kibana.service
sudo systemctl start kibana.service

Verifica el estado:

sudo systemctl status kibana.service

Ahora deberías poder acceder a Kibana abriendo tu navegador en `http://TU_IP_DEL_SERVIDOR:5601`.

Paso 5: Ingesta de Datos y Exploración Inicial

Con ELK montado, necesitamos enviar datos. Puedes reconfigurar Logstash para leer logs de archivos, usar Beats (Filebeat es el más común para logs), o enviar datos directamente a través de su API. Para este ejemplo, asumimos que reconfiguraste `syslog.conf` para leer logs de `/var/log/syslog` (cambiando el input `syslog` por `file` y especificando el `path`).

Tras reiniciar Logstash y enviar algunos logs (o esperar que se generen), ve a Kibana. Ve a Stack Management -> Index Patterns y crea un nuevo índice. Usa el patrón `logstash-*` y selecciona `@timestamp` como campo de tiempo.

Una vez creado el índice, navega a Discover. Deberías ver tus logs fluyendo. ¡Felicidades! Has montado tu primer stack ELK.

Arsenal del Operador/Analista

Construir tu capacidad de threat hunting va más allá de montar ELK. Aquí hay algunas herramientas y recursos que todo analista de seguridad debería considerar:

  • Filebeat: Ligero agente de ELK para la ingesta de logs de archivos. Esencial para enviar logs desde múltiples fuentes a Logstash o directamente a Elasticsearch.
  • Packetbeat: Analiza el tráfico de red y lo envía a Elasticsearch para su análisis en Kibana. Ideal para monitorizar la actividad de red.
  • Auditd: El subsistema de auditoría de Linux, crucial para registrar la actividad del sistema operativo.
  • Wireshark: El estándar de facto para el análisis de paquetes de red. Indispensable para la investigación profunda de tráfico.
  • Sysmon: Una herramienta de Microsoft Sysinternals que monitoriza y registra la actividad del sistema detalladamente.
  • Libros Clave:
    • "The ELK Stack in Action" por Pratik Dhar e Ivan P.)
  • Plataformas de Bug Bounty: HackerOne, Bugcrowd (para entender cómo los atacantes buscan vulnerabilidades).
  • Certificaciones: OSCP (Offensive Security Certified Professional) de Offensive Security, GCTI (GIAC Certified Incident Handler) de SANS.

Veredicto del Ingeniero: ¿Vale la pena automatizar tu defensa?

Montar y mantener un stack ELK requiere una inversión significativa de tiempo y recursos. ¿Es rentable? Absolutamente. Para cualquier organización que se tome en serio la seguridad, la capacidad de visibilidad profunda que ofrece ELK es insustituible. No se trata solo de "montar ELK", sino de integrarlo en un proceso de threat hunting activo.

Pros:

  • Visibilidad granular y centralizada de logs.
  • Capacidad de correlación de eventos y detección de amenazas avanzadas.
  • Plataforma escalable y flexible para análisis de big data.
  • Ecosistema robusto con Elastic Beats.

Contras:

  • Curva de aprendizaje pronunciada.
  • Requiere recursos considerables (CPU, RAM, Disco).
  • Mantenimiento y optimización constantes.

Si estás operando en un entorno con superficie de ataque significativa, la respuesta es un rotundo sí. La alternativa es operar en la oscuridad, esperando que las amenazas te encuentren antes de que tú las encuentres.

Preguntas Frecuentes

  • ¿Puedo ejecutar ELK Stack en una sola máquina? Sí, para propósitos de aprendizaje o entornos pequeños. Para producción, se recomienda un despliegue distribuido.
  • ¿Qué tan rápido puedo esperar ver mis logs en Kibana? Depende de tu configuración de Logstash y la latencia de red. Con una configuración local y optimizada, debería ser cuestión de segundos o minutos.
  • ¿Cómo optimizo el rendimiento de Elasticsearch? La optimización es clave: hardware adecuado, configuración de JVM, sharding y replicación correctos, y optimización de consultas.
  • ¿Qué tipo de datos debería enviar a ELK? Prioriza logs de seguridad críticos: autenticación, auditoría del sistema, logs de aplicaciones web, logs de firewalls, y tráfico de red si usas Packetbeat.

El Contrato: Tu Primer Log de Anomalía

Has construido la máquina. Ahora, la verdadera caza comienza. Tu primer desafío es simple pero fundamental: identifica una anomalía que no debería estar en tus logs.

Configura tus fuentes de datos para enviar logs a tu ELK stack. Pasa un tiempo significativo explorando los datos en Kibana. Busca patrones inusuales, eventos de error que no esperas, intentos de conexión a puertos desconocidos, o actividades a horas inusuales. Documenta lo que encuentras, por qué lo consideras una anomalía, y cómo podrías usar esta información para refinar tus reglas de detección o tus consultas de threat hunting.

Este es solo el comienzo. La red es un laberinto de sistemas heredados y configuraciones defectuosas donde solo sobreviven los metódicos. Ahora, es tu turno. ¿Estás de acuerdo con mi análisis o crees que hay un enfoque más eficiente? Demuéstralo con tu primer hallazgo de anomalía en los comentarios.

```

Guía Definitiva: Montando ELK Stack para Cyber Threat Hunting Avanzado

La luz parpadeante del monitor era la única compañía mientras los logs del servidor escupían una anomalía. Una que no debería estar ahí. En este submundo digital, las amenazas no anuncian su llegada, se deslizan por las grietas, susurran en el silencio de los sistemas inatentos. Hoy no vamos a parchear un sistema, vamos a construir el puesto de avanzada, la sala de control desde donde cazaremos a esos fantasmas en la máquina. Hablamos de la infraestructura esencial para cualquier operación de Threat Hunting: el ELK Stack.

Este conjunto de herramientas, comúnmente conocido como ELK (Elasticsearch, Logstash, Kibana), es la columna vertebral para recopilar, analizar y visualizar grandes volúmenes de datos de seguridad. Si tu objetivo es detectar y responder a incidentes de forma proactiva, entonces dominar el montaje y la configuración de ELK no es una opción, es una necesidad cruda. Este no es un tutorial para principiantes que buscan evitar el trabajo; esto es para aquellos que están listos para ensuciarse las manos y construir su propio campo de batalla digital.

Tabla de Contenidos

¿Por qué ELK para Threat Hunting?

En la guerra digital, la inteligencia es tu mejor arma. El Threat Hunting no es sobre reaccionar a alertas predefinidas; es sobre la búsqueda activa de amenazas que han logrado evadir los controles de seguridad tradicionales. Necesitas visibilidad. Necesitas la capacidad de correlacionar eventos que, individualmente, parecen inofensivos, pero que juntos pintan un cuadro aterrador de compromised. Aquí es donde ELK brilla.

Mientras que otras soluciones pueden ofrecer alertas puntuales, ELK te da el lienzo crudo. Elasticsearch almacena y indexa tus logs a una velocidad vertiginosa, Logstash actua como tu agente de inteligencia en el campo, recolectando y transformando datos crudos en información procesable, y Kibana te proporciona una interfaz para visualizar patrones, identificar anomalías y contar la historia de lo que realmente está sucediendo en tu red.

"La información es poder. La información mal organizada es ruido." - Un hacker anónimo que perdió su acceso por no saber leer sus propios logs.

Ignorar la recopilación y el análisis de logs es como navegar a ciegas en un campo minado. Necesitas una herramienta que convierta el ruido de miles de eventos diarios en datos significativos. Para un operador de seguridad, construir y mantener un entorno ELK robusto es tan fundamental como tener un buen endpoint protection. Es la base sobre la que construyes tu capacidad de detección y respuesta.

Desglosando el ELK Stack: Roles y Funciones

Antes de empezar a teclear comandos, entendamos la arquitectura de este sistema. Simplificado, cada componente cumple un rol crítico en la cadena de procesamiento de la inteligencia:

  • Elasticsearch (E): Piensa en Elasticsearch como el cerebro de análisis. Es un motor de búsqueda y análisis distribuido, basado en Apache Lucene. Su principal fortaleza es la capacidad de indexar y buscar grandes volúmenes de datos JSON de manera rápida y escalable. Para el threat hunting, esto significa poder hacer consultas complejas sobre terabytes de logs en cuestión de segundos.
  • Logstash (L): Logstash es el agente de campo, el recolector de inteligencia. Es un pipeline de procesamiento de datos del lado del servidor que ingiere datos de múltiples fuentes simultáneamente, los transforma (filtrando, analizando, enriqueciendo) y luego los envía a un "stash" de tu elección, que en nuestro caso será Elasticsearch. Puede manejar logs de firewalls, servidores web, aplicaciones, sistemas operativos, y prácticamente cualquier cosa que genere eventos.
  • Kibana (K): Kibana es tu centro de mando visual. Es la interfaz de usuario para Elasticsearch. Te permite explorar tus datos indexados, crear visualizaciones (gráficos, mapas, tablas), y construir dashboards interactivos. Para un cazador de amenazas, Kibana transforma la abstracción de los datos crudos en patrones visibles, permitiendo identificar comportamientos anómalos que de otra manera pasarían desapercibidos.

La sinergia entre estos tres componentes crea un sistema poderoso para la observabilidad y la seguridad. Sin embargo, el verdadero valor no reside en el software en sí, sino en cómo lo configuras y utilizas como parte de una estrategia de threat hunting bien definida.

Taller Práctico: Montando tu Máquina Hunter con ELK

Ahora, la parte que realmente importa: construir la maquinaria. Este tutorial te guiará a través del montaje de un entorno ELK funcional en una máquina dedicada (o una VM robusta). Asumo que tienes conocimientos básicos de administración de sistemas Linux y manejo de la terminal.

Nota Importante: Para un entorno de producción real, se recomienda desplegar ELK en un cluster distribuido para alta disponibilidad y escalabilidad. Este montaje es ideal para aprendizaje, pruebas o entornos de laboratorio.

Paso 1: Preparación del Terreno (Sistema Operativo y Requisitos)

Necesitarás un sistema operativo Linux (recomendamos Ubuntu Server LTS o Debian). Asegúrate de tener suficiente RAM (mínimo 8GB, idealmente 16GB o más para producción) y espacio en disco. También es crucial instalar Java Development Kit (JDK), ya que Elasticsearch y Logstash lo requieren.

Asegúrate de que tu sistema esté actualizado:

sudo apt update && sudo apt upgrade -y

Instala el JDK (OpenJDK es una opción sólida):

sudo apt install openjdk-17-jdk -y

Verifica la instalación de Java:

java -version

Es fundamental configurar `limits.conf` para permitir que Elasticsearch maneje más archivos abiertos y memoria virtual. Añade estas líneas al final de `/etc/security/limits.conf`:


  • soft nofile 65536
  • hard nofile 65536
root soft nofile 65536 root hard nofile 65536
  • soft nproc 2048
  • hard nproc 2048
root soft nproc 2048 root hard nproc 2048

Y en `/etc/sysctl.conf` para aumentar el límite de memoria virtual:


vm.max_map_count=262144

Aplica los cambios de `sysctl`:

sudo sysctl -p

Paso 2: Instalando Elasticsearch - El Cerebro

Elasticsearch se puede instalar añadiendo su repositorio oficial. Primero, instala las dependencias necesarias:

sudo apt install apt-transport-https curl gnupg -y

Añade la clave GPG de Elastic:

curl -fsSL https://artifacts.elastic.co/GPG-KEY-elasticsearch | sudo gpg --dearmor -o /usr/share/keyrings/elasticsearch-keyring.gpg

Añade el repositorio de Elastic:

echo "deb [signed-by=/usr/share/keyrings/elasticsearch-keyring.gpg] https://artifacts.elastic.co/packages/8.x/apt stable main" | sudo tee /etc/apt/sources.list.d/elastic-8.x.list

Actualiza la lista de paquetes e instala Elasticsearch:

sudo apt update && sudo apt install elasticsearch -y

Habilita y inicia el servicio de Elasticsearch:

sudo systemctl daemon-reload
sudo systemctl enable elasticsearch.service
sudo systemctl start elasticsearch.service

Verifica que Elasticsearch esté corriendo:

sudo systemctl status elasticsearch.service

Espera a que el servicio se inicie completamente y luego prueba a consultarlo:

curl -X GET "localhost:9200"

Deberías obtener una respuesta JSON con detalles de tu nodo Elasticsearch. Si no está accesible, revisa los logs (`/var/log/elasticsearch/`) y la configuración en `/etc/elasticsearch/elasticsearch.yml`.

Paso 3: Configurando Logstash - El Recolector Implacable

Continuamos con Logstash. Usa los mismos repositorios que para Elasticsearch para instalar su última versión:

sudo apt update && sudo apt install logstash -y

Logstash se configura mediante archivos de configuración. Crearemos un archivo para definir la entrada, el filtro y la salida de nuestros datos. Por ejemplo, para recibir logs de Syslog y enviarlos a Elasticsearch:

Crea un archivo de configuración en `/etc/logstash/conf.d/`, por ejemplo, `syslog.conf`:

sudo nano /etc/logstash/conf.d/syslog.conf

Pega la siguiente configuración básica:

input {
  syslog {
    port => 5454
    type => "syslog"
  }
}
filter {
  if [type] == "syslog" {
    grok {
      match => { "message" => "%{SYSLOGTIMESTAMP:syslog_timestamp} %{SYSLOGHOST:syslog_hostname} %{DATA:syslog_program}(?:[%{NUMBER:syslog_pid}])?: %{GREEDYDATA:syslog_message}" }
    }
    date {
      match => [ "syslog_timestamp", "MMM  d HH:mm:ss", "MMM dd HH:mm:ss" ]
    }
  }
}
output {
  elasticsearch {
    hosts => ["localhost:9200"]
    index => "logstash-%{type}-%{+YYYY.MM.dd}"
  }
}

Guarda y cierra el archivo (Ctrl+X, Y, Enter). Ahora, habilita e inicia el servicio de Logstash:

sudo systemctl daemon-reload
sudo systemctl enable logstash.service
sudo systemctl start logstash.service

Verifica el estado y los logs de Logstash si encuentras problemas.

Paso 4: Desplegando Kibana - La Ventana al Caos

Kibana es la interfaz gráfica que nos permitirá interactuar con Elasticsearch. Se instala de manera similar a los componentes anteriores:

sudo apt update && sudo apt install kibana -y

La configuración principal de Kibana se encuentra en `/etc/kibana/kibana.yml`. Asegúrate de que la siguiente línea esté descomentada y configurada correctamente (si no, añádela):

server.port: 5601
elasticsearch.hosts: ["http://localhost:9200"]

Si planeas acceder a Kibana desde otra máquina, también descomenta y configura `server.host`:

server.host: "0.0.0.0"

Habilita e inicia Kibana:

sudo systemctl daemon-reload
sudo systemctl enable kibana.service
sudo systemctl start kibana.service

Verifica el estado:

sudo systemctl status kibana.service

Ahora deberías poder acceder a Kibana abriendo tu navegador en `http://TU_IP_DEL_SERVIDOR:5601`.

Paso 5: Ingesta de Datos y Exploración Inicial

Con ELK montado, necesitamos enviar datos. Puedes reconfigurar Logstash para leer logs de archivos, usar Beats (Filebeat es el más común para logs), o enviar datos directamente a través de su API. Para este ejemplo, asumimos que reconfiguraste `syslog.conf` para leer logs de `/var/log/syslog` (cambiando el input `syslog` por `file` y especificando el `path`).

Tras reiniciar Logstash y enviar algunos logs (o esperar que se generen), ve a Kibana. Ve a Stack Management -> Index Patterns y crea un nuevo índice. Usa el patrón `logstash-*` y selecciona `@timestamp` como campo de tiempo.

Una vez creado el índice, navega a Discover. Deberías ver tus logs fluyendo. ¡Felicidades! Has montado tu primer stack ELK.

Arsenal del Operador/Analista

Construir tu capacidad de threat hunting va más allá de montar ELK. Aquí hay algunas herramientas y recursos que todo analista de seguridad debería considerar:

  • Filebeat: Ligero agente de ELK para la ingesta de logs de archivos. Esencial para enviar logs desde múltiples fuentes a Logstash o directamente a Elasticsearch.
  • Packetbeat: Analiza el tráfico de red y lo envía a Elasticsearch para su análisis en Kibana. Ideal para monitorizar la actividad de red.
  • Auditd: El subsistema de auditoría de Linux, crucial para registrar la actividad del sistema operativo.
  • Wireshark: El estándar de facto para el análisis de paquetes de red. Indispensable para la investigación profunda de tráfico.
  • Sysmon: Una herramienta de Microsoft Sysinternals que monitoriza y registra la actividad del sistema detalladamente.
  • Libros Clave:
    • "The ELK Stack in Action" por Pratik Dhar e Ivan P.)
  • Plataformas de Bug Bounty: HackerOne, Bugcrowd (para entender cómo los atacantes buscan vulnerabilidades).
  • Certificaciones: OSCP (Offensive Security Certified Professional) de Offensive Security, GCTI (GIAC Certified Incident Handler) de SANS.

Veredicto del Ingeniero: ¿Vale la pena automatizar tu defensa?

Montar y mantener un stack ELK requiere una inversión significativa de tiempo y recursos. ¿Es rentable? Absolutamente. Para cualquier organización que se tome en serio la seguridad, la capacidad de visibilidad profunda que ofrece ELK es insustituible. No se trata solo de "montar ELK", sino de integrarlo en un proceso de threat hunting activo.

Pros:

  • Visibilidad granular y centralizada de logs.
  • Capacidad de correlación de eventos y detección de amenazas avanzadas.
  • Plataforma escalable y flexible para análisis de big data.
  • Ecosistema robusto con Elastic Beats.

Contras:

  • Curva de aprendizaje pronunciada.
  • Requiere recursos considerables (CPU, RAM, Disco).
  • Mantenimiento y optimización constantes.

Si estás operando en un entorno con superficie de ataque significativa, la respuesta es un rotundo sí. La alternativa es operar en la oscuridad, esperando que las amenazas te encuentren antes de que tú las encuentres.

Preguntas Frecuentes

  • ¿Puedo ejecutar ELK Stack en una sola máquina? Sí, para propósitos de aprendizaje o entornos pequeños. Para producción, se recomienda un despliegue distribuido.
  • ¿Qué tan rápido puedo esperar ver mis logs en Kibana? Depende de tu configuración de Logstash y la latencia de red. Con una configuración local y optimizada, debería ser cuestión de segundos o minutos.
  • ¿Cómo optimizo el rendimiento de Elasticsearch? La optimización es clave: hardware adecuado, configuración de JVM, sharding y replicación correctos, y optimización de consultas.
  • ¿Qué tipo de datos debería enviar a ELK? Prioriza logs de seguridad críticos: autenticación, auditoría del sistema, logs de aplicaciones web, logs de firewalls, y tráfico de red si usas Packetbeat.

El Contrato: Tu Primer Log de Anomalía

Has construido la máquina. Ahora, la verdadera caza comienza. Tu primer desafío es simple pero fundamental: identifica una anomalía que no debería estar en tus logs.

Configura tus fuentes de datos para enviar logs a tu ELK stack. Pasa un tiempo significativo explorando los datos en Kibana. Busca patrones inusuales, eventos de error que no esperas, intentos de conexión a puertos desconocidos, o actividades a horas inusuales. Documenta lo que encuentras, por qué lo consideras una anomalía, y cómo podrías usar esta información para refinar tus reglas de detección o tus consultas de threat hunting.

Este es solo el comienzo. La red es un laberinto de sistemas heredados y configuraciones defectuosas donde solo sobreviven los metódicos. Ahora, es tu turno. ¿Estás de acuerdo con mi análisis o crees que hay un enfoque más eficiente? Demuéstralo con tu primer hallazgo de anomalía en los comentarios.