
The digital realm is a graveyard of forgotten vulnerabilities and exploited misconfigurations. In this labyrinth of ones and zeros, silence often screams louder than noise. Threat actors thrive in the shadows, moving with the stealth of a phantom limb. Your mission, should you choose to accept it, is not to chase ghosts, but to understand their footprints. Today, we strip down the mechanics of proactive defense, dissecting the ELK Stack – Elasticsearch, Logstash, Kibana – augmented by Beats, as our weapon of choice for advanced threat hunting.
This isn't about simply collecting logs; it's about building an intelligent surveillance system, a digital nervous system that can detect the faintest tremor of malicious intent before it becomes a catastrophic breach. We’re not just patching holes; we’re fortifying the walls based on an intimate understanding of the enemy's methods. Let’s turn passive observation into active intel.
Table of Contents
- Introduction: The Art of Proactive Defense
- ELK Stack Overview: The Core Components
- Beats: The Eyes and Ears on the Ground
- The Threat Hunting Methodology
- Hypothesis-Driven Hunting: Formulating Your Attack Vectors
- Data Ingestion and Enrichment with Logstash
- Leveraging Elasticsearch for Deep Analysis
- Kibana: Visualizing the Threat Landscape
- Practical Hunting Scenarios and Queries
- Advanced Techniques and Considerations
- Verdict of the Engineer: Is ELK Prime for Your Defense?
- Arsenal of the Operator/Analyst
- Defensive Workshop: Detecting Lateral Movement
- Frequently Asked Questions
- The Contract: Your First Threat Hunt Challenge
Introduction: The Art of Proactive Defense
In the perpetual cat-and-mouse game of cybersecurity, waiting for an alert is a losing strategy. True security professionals don't react; they anticipate. Threat hunting is the embodiment of this proactive stance – the deliberate, iterative search through networks and systems for undetected threats. It’s about assuming compromise and hunting for the evidence. The ELK Stack, a powerful open-source suite, coupled with the lightweight Beats data shippers, provides the foundational tools for such an endeavor. This isn't about magic; it's about methodical investigation, transforming raw log data into actionable intelligence.
Consider this your field manual. We’ll break down the architecture, the methodology, and the practical application of ELK for hunting down adversaries who think they're invisible.
ELK Stack Overview: The Core Components
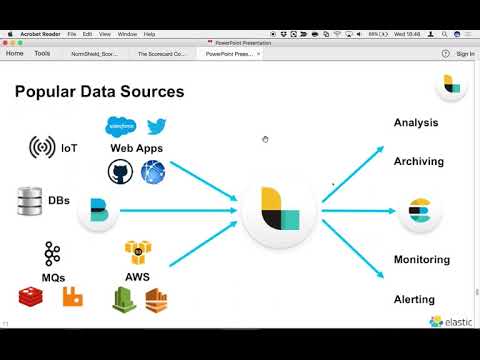
The ELK Stack is a synergy of three robust open-source projects, each playing a crucial role in the data lifecycle from ingestion to visualization:
- Elasticsearch: At its heart, Elasticsearch is a distributed search and analytics engine. It excels at indexing, searching, and analyzing large volumes of data in near real-time. Think of it as the secure vault where all your intel is stored and readily accessible. Its RESTful API makes it highly programmable and integrable into complex security workflows.
- Logstash: This is the data processing pipeline. Logstash ingests data from myriad sources, transforms it (parsing, filtering, enriching), and then outputs it to a storage backend, in our case, Elasticsearch. It’s the meticulous archivist, ensuring data is clean, structured, and ready for analysis.
- Kibana: The visualization layer. Kibana provides a web interface to explore, visualize, and dashboard your Elasticsearch data. It allows security analysts to craft queries, build dynamic charts, and create comprehensive dashboards that paint a clear picture of the network's health and any anomalies. It’s the detective's magnifying glass and corkboard, connecting the dots.
Beats: The Eyes and Ears on the Ground
While ELK forms the core, Beats are the lightweight, single-purpose data shippers that collect and forward data to Logstash or directly to Elasticsearch. They are designed to be efficient and resource-light:
- Filebeat: Tails log files and forwards them. Essential for capturing application logs, system logs, and any file-based data.
- Metricbeat: Collects system-level and service-related metrics. Think CPU, memory, disk I/O, and statistics from services like Nginx, Apache, or databases.
- Packetbeat: Monitors network traffic in real-time, inspecting raw network packets and extracting vital information about your network communications.
- Winlogbeat: Specifically for Windows, it collects security event logs, including login/logout events, process creation, and more.
- Auditbeat: Collects audit data and enforces integrity monitoring on filesystems.
The strategic deployment of these Beats across your infrastructure ensures comprehensive data visibility, forming the bedrock of any effective threat hunting operation.
The Threat Hunting Methodology
Threat hunting is not a random act. It’s a disciplined process, often iterative, that can be broken down into key phases:
- Hypothesis Formulation: Start with a suspicion. What could an attacker be doing? What indicators would that leave?
- Data Collection: Identify and collect the relevant data sources (logs, network traffic, endpoint telemetry) that would support or refute your hypothesis.
- Data Analysis: Utilize tools like ELK to examine the collected data. Look for anomalies, deviations from baseline, and known malicious patterns (Indicators of Compromise - IoCs).
- Discovery and Investigation: If potential threats are found, dive deeper. Correlate events, trace activity, and gather evidence.
- Response and Remediation: Once a threat is confirmed, initiate incident response procedures to contain, eradicate, and recover.
- Feedback and Refinement: Use the findings to improve your defenses, update hunting hypotheses, and enhance data collection.
This cycle is continuous. The digital battleground is dynamic, and so must be your hunting strategy.
Hypothesis-Driven Hunting: Formulating Your Attack Vectors
Randomly sifting through logs is like searching for a needle in a haystack blindfolded. A hypothesis provides direction. It’s a educated guess about potential attacker behavior tailored to your environment. Think like an adversary:
- Lateral Movement: "An attacker has gained initial access and is attempting to move to other systems. I'll hunt for unusual RDP or SMB connections from workstations to servers, or suspicious PowerShell remoting activity."
- Data Exfiltration: "An insider or compromised account is trying to steal data. I'll hunt for large outbound data transfers from unexpected sources, or access patterns to sensitive file shares outside normal working hours."
- Persistence: "An attacker has established a foothold and is trying to maintain access. I'll hunt for new scheduled tasks, unusual registry modifications in startup keys, or the creation of hidden services."
- Credential Harvesting: "An attacker is trying to steal credentials. I'll hunt for multiple failed login attempts followed by a success on a single account, NTLM relay attacks, or suspicious usage of `Mimikatz` or similar tools on endpoints."
Each hypothesis translates into specific data points, query patterns, and analytical techniques. Your ELK stack becomes the forensic lab for validating these suspicions.
Data Ingestion and Enrichment with Logstash
Logstash is the workhorse of your data pipeline. It's where raw, disparate logs are transformed into a structured, queryable format.
A typical Logstash configuration involves three sections: input, filter, and output.
Example Filter Configuration: Parsing Windows Event Logs
filter {
  if [type] == "wineventlog" {
    grok {
      match => { "message" => "%{GREEDYDATA:winevent_data}" }
    }
    # Example: Parse specific events like process creation (Event ID 4688)
    if [event_id] == 4688 {
      grok {
        match => { "winevent_data" => "A new process has been created.\n\nSubject:\n\tAccount Name:\t%{DATA:subject_account_name}\n\nNew Process:\n\tNew Process Name:\t%{DATA:process_name}\n\tCommand Line:\t%{GREEDYDATA:process_command_line}" }
      }
      mutate {
        remove_field => ["winevent_data"]
      }
    }
    # GeoIP enrichment for network events
    if [client.ip] {
      geoip {
        source => "client.ip"
      }
    }
  }
}
Enrichment: Logstash can enrich your data with contextual information. For instance, if you're processing network logs with client IP addresses, you can use the geoip filter to add geographical location data. For security events, you might use a dictionary filter to map internal IP addresses to hostnames or asset criticality, transforming raw IPs into meaningful context for hunting.
Leveraging Elasticsearch for Deep Analysis
Once data lands in Elasticsearch, its true power for threat hunting emerges. Elasticsearch’s query DSL (Domain Specific Language) allows for complex searches, aggregations, and pattern detection.
Key Concepts for Hunting:
- Index Patterns: Define how Kibana interacts with your Elasticsearch indices. For time-series data like logs, you'll typically use index templates with date-based indices (e.g.,
filebeat-7.x.x-YYYY.MM.DD). - Query DSL: The foundation of searches. You can construct queries using both a JSON-based DSL and a simpler Query String syntax.
- Aggregations: Powerful tools to summarize data, such as finding the top N IP addresses, counting events by type, or calculating statistical distributions.
- KQL (Kibana Query Language): A user-friendly syntax for Kibana searches, allowing quick filtering and exploration.
Hunting involves crafting queries that deviate from the norm. For example, looking for processes running from unusual directories, or detecting authentication attempts from geographically improbable locations.
Kibana: Visualizing the Threat Landscape
Kibana transforms your raw data and complex Elasticsearch queries into human-readable insights. It’s where you’ll spend much of your time during a hunt.
- Discover: The primary interface for ad-hoc searching and data exploration. You can filter, view raw logs, and build initial queries here.
- Visualize: Create charts, graphs, maps, and other visualizations based on Elasticsearch data using aggregations.
- Dashboard: Assemble your visualizations into comprehensive dashboards. A well-designed dashboard can provide an immediate overview of your security posture and highlight potential threats.
- Machine Learning (Commercial Feature): For advanced anomaly detection, Elasticsearch's ML features can automatically identify unusual patterns in your data that might indicate threats.
For threat hunting, you'll create dashboards monitoring key security indicators: authentication failures, suspicious process executions, unusual network connections, and deviations from established baselines.
Practical Hunting Scenarios and Queries
Let's get hands-on. Here are a few hypotheses and corresponding query concepts:
Hypothesis: A user is running PowerShell scripts from an unusual location or with suspicious parameters, indicating potential malicious scripting.
Kibana Query (KQL):
process.name : "powershell.exe" and (process.command_line : "*encodedCommand*" or process.command_line : "*-w hidden*")
This query looks for powershell.exe processes where the command line indicates encoded commands or hidden windows – common tactics for obfuscating malicious scripts.
Hypothesis: An attacker is attempting to access sensitive shares using default or weak credentials.
Kibana Query (KQL):
event.action : "access_shared_folder" and user.name : ("Administrator", "guest", "root")
This could be adapted for various log sources (e.g., SMB logs, Windows Security Event IDs) to catch attempts to access resources with highly privileged or default accounts.
Hypothesis: Suspicious network connections from internal hosts to known malicious IPs or unusual ports.
Kibana Query (KQL):
event.category : "network" and destination.ip : (lookup_ip_list_of_bad_ips) and destination.port != (80, 443, 22)
This requires maintaining a curated list of known bad IPs or observing connections to non-standard ports from internal assets.
Advanced Techniques and Considerations
- Data Normalization: Standardizing log formats across different sources is crucial for effective querying. Elastic Common Schema (ECS) is highly recommended.
- Baselining: Understand what "normal" looks like in your environment. This allows you to more easily spot deviations.
- Threat Intelligence Integration: Feed threat intelligence feeds (lists of malicious IPs, domains, hashes) into Logstash or Elasticsearch to automatically flag suspicious activity.
- Tuning Alerts: Once hunting, you'll find patterns that warrant automated alerting. Tune these carefully to minimize false positives.
- Performance Optimization: For very large datasets, optimize Elasticsearch cluster performance through proper indexing strategies, shard management, and hardware allocation.
- Security of ELK Deployment: Treat your ELK stack as a critical security asset. Ensure it's hardened, monitored, and access-controlled.
Verdict of the Engineer: Is ELK Prime for Your Defense?
The ELK Stack, especially when combined with Beats, is a powerhouse for centralized logging, analysis, and threat hunting. Its open-source nature makes it accessible, while its scalability and flexibility make it suitable for environments ranging from small businesses to large enterprises.
Pros:
- Powerful search and analysis capabilities.
- Flexible data ingestion and transformation.
- Rich visualization and dashboarding.
- Large, active open-source community.
- Scalable architecture.
- Excellent for anomaly detection and hypothesis-driven hunting.
Cons:
- Can be resource-intensive to operate and scale effectively.
- Requires significant expertise to configure, tune, and maintain for optimal performance and security.
- Some advanced features (like robust ML anomaly detection or advanced security hardening) are part of the commercial Elastic Stack subscriptions.
- Requires a strong understanding of data formats, query languages, and threat actor methodologies.
Decision: For organizations serious about moving beyond reactive security to proactive threat hunting, the ELK Stack is an indispensable tool. It provides the visibility needed to detect the subtle signs of compromise. However, it's not a set-and-forget solution. It demands skilled operators, continuous tuning, and a commitment to defensive strategy.
Arsenal of the Operator/Analyst
- Software:
- Elastic Stack (ELK + Beats): The core platform.
- Wireshark/Tshark: For deep packet inspection when network telemetry raises flags.
- Sysinternals Suite: Essential for endpoint analysis and investigation.
- CyberChef: The "Swiss Army knife" for decoding/encoding data encountered during hunts.
- Hardware:
- A robust server infrastructure or cloud resources capable of handling the ELK cluster's demands.
- Books:
- "The ELK Stack in Action"
- "Gray Hat Hacking: The Ethical Hacker's Handbook"
- "Hands-On Network Forensics and Penetration Testing"
- Certifications:
- Consider Elastic Certified Engineer.
- For broader security skills: OSCP, CISSP, GIAC certifications.
Defensive Workshop: Detecting Lateral Movement
Lateral movement is a critical phase for attackers. Detecting it early can shut down an entire campaign. Let's focus on detecting RDP/SSH brute-force or abuse.
Objective: Identify suspicious login patterns indicative of an attacker trying to gain access to multiple internal systems.
Data Sources Required:
- Windows Security Event Logs (Event ID 4624 for successful logins, 4625 for failed logins, 4648 for explicit credential usage).
- Linux Secure Logs (auth.log or equivalent) for SSH login attempts.
- Network logs (Packetbeat or firewall logs) for RDP (3389) or SSH (22) connections.
Steps for Hunting:
- Establish Baselines: What are the typical login times and sources for your key servers and user accounts?
- Hunt for Brute Force: Query for multiple failed login attempts (Event ID 4625 / SSH auth failures) from a single source IP to multiple destination IPs or accounts within a short timeframe.
- Hunt for Account Sweeping: Query for successful logins (Event ID 4624 / SSH success) for highly privileged accounts (e.g., Domain Admins, root) from unusual source IPs or at unusual times.
- Hunt for Explicit Credential Usage: Look for Event ID 4648 on Windows, which signifies a logon attempt using explicit credentials. This is often used by tools like PsExec or Mimikatz. Correlate this with process creation logs for these tools.
- Network Correlation: Use network data to see if the source IPs identified in login events are also initiating RDP/SSH connections.
Example KQL for Windows:
event.code : 4625 and _exists_: "user.name" and _exists_: "source.ip"
Then, aggregate by source.ip and count distinct user.name and occurrences within a rolling time window.
Example KQL for Windows:
event.code : 4624 and user.name : "Administrator" and NOT source.ip : (trusted_admin_workstations_cidr)
Frequently Asked Questions
Q1: How much data can ELK handle?
A: Elasticsearch is designed for massive scalability. Its performance depends heavily on hardware, indexing strategy, cluster configuration, and the volume/complexity of data. It can scale to petabytes of data.
Q2: Is ELK difficult to set up?
A: Basic setup can be straightforward, especially with pre-built distributions or Docker. However, optimizing for production, security hardening, and scaling requires significant expertise and ongoing effort.
Q3: Can I use ELK for real-time alerting?
A: Yes. Kibana has alerting features (X-Pack alerting, or custom solutions using Elasticsearch's Watcher API) that can trigger notifications based on detected patterns or anomalies.
Q4: What's the difference between Logstash and Beats?
A: Beats are lightweight shippers for collecting specific types of data. Logstash is a more powerful, general-purpose data processing pipeline that can ingest from various sources (including Beats), transform, filter, and output data.
Q5: How do I protect my ELK cluster itself?
A: Implement strong authentication and authorization, encrypt data in transit (TLS/SSL), restrict network access to the cluster, regularly patch all components, and monitor the cluster's own logs for suspicious activity.
The Contract: Your First Threat Hunt Challenge
You've seen the blueprint. Now, it's time to execute. Your contract is to devise and articulate a threat hunting hypothesis for detecting the presence of known Cobalt Strike beacons within your network, assuming you have access to network traffic logs (via Packetbeat) and endpoint process execution logs (via Filebeat/Winlogbeat).
For each hypothesis:
- Clearly state the hypothesis.
- Identify the specific fields and data points you would look for in your logs.
- Provide example Kibana Query Language (KQL) snippets or Elasticsearch DSL queries that could help detect this activity.
Don't just collect logs; hunt with purpose. The shadows are vast, but with the right tools and a sharp mind, no adversary is truly invisible.
No comments:
Post a Comment