The digital realm is a battlefield, and data is the ultimate weapon. In this landscape, Python has emerged as the dominant force for those who wield the power of data science. Forget the fairy tales of effortless analysis; this is about the grit, the code, and the relentless pursuit of insights hidden within raw information. Today, we strip down the components of a data science arsenal, focusing on Python's indispensable role.
The Data Scientist's Mandate: Beyond the Buzzwords
The term "Data Scientist" often conjures images of black magic. In reality, it's a disciplined craft. It’s about understanding the data's narrative, identifying its anomalies, and extracting actionable intelligence. This requires more than just knowing a few library functions; it demands a foundational understanding of mathematics, statistics, and the very algorithms that drive discovery. We're not just crunching numbers; we're building models that predict, classify, and inform critical decisions. This isn't a hobby; it's a profession that requires dedication and the right tools.
Unpacking the Python Toolkit for Data Operations
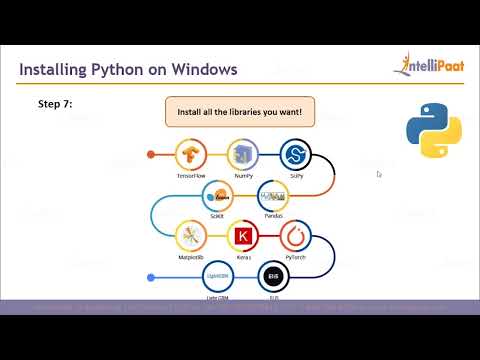
Python's ubiquity in data science isn't accidental. Its clear syntax and vast ecosystem of libraries make it the lingua franca for data practitioners. To operate effectively, you need to master these core components:
NumPy: The Bedrock of Numerical Computation
At the heart of numerical operations in Python lies NumPy. It provides efficient array objects and a collection of routines for mathematical operations. Think of it as the low-level engine that powers higher-level libraries. Without NumPy, data manipulation would be a sluggish, memory-intensive nightmare.
Pandas: The Data Wrangler's Best Friend
When it comes to data manipulation and analysis, Pandas is king. Its DataFrame structure is intuitive, allowing you to load, clean, transform, and explore data with unparalleled ease. From handling missing values to merging datasets, Pandas offers a comprehensive set of tools to prepare your data for analysis. It’s the backbone of most data science workflows, turning messy raw data into structured assets.
Matplotlib: Visualizing the Unseen
Raw data is largely inscrutable. Matplotlib, along with its extensions like Seaborn, provides the means to translate complex datasets into understandable visualizations. Graphs, charts, and plots reveal trends, outliers, and patterns that would otherwise remain buried. Effective data visualization is crucial for communicating findings and building trust in your analysis. It’s how you show your client the ghosts in the machine.
The Mathematical Underpinnings of Data Intelligence
Data science is not a purely computational endeavor. It's deeply rooted in mathematical and statistical principles. Understanding these concepts is vital for selecting the right algorithms, interpreting results, and avoiding common pitfalls:
Statistics: The Art of Inference
Descriptive statistics provide a summary of your data, while inferential statistics allow you to make educated guesses about a larger population based on a sample. Concepts like mean, median, variance, standard deviation, probability distributions, and hypothesis testing are fundamental. They are the lenses through which we examine data to draw meaningful conclusions.
Linear Algebra: The Language of Transformations
Linear algebra provides the framework for understanding many machine learning algorithms. Concepts like vectors, matrices, eigenvalues, and eigenvectors are crucial for tasks such as dimensionality reduction (e.g., PCA) and solving systems of linear equations that underpin complex models. It's the grammar for describing how data spaces are transformed.
Algorithmic Strategies: From Basics to Advanced
Once the data is prepared and the mathematical foundations are in place, the next step is applying algorithms to extract insights. Python libraries offer robust implementations, but understanding the underlying mechanics is key.
Regularization and Cost Functions
In model building, preventing overfitting is paramount. Regularization techniques (like L1 and L2) add penalties to the model's complexity, discouraging it from becoming too tailored to the training data. Cost functions, such as Mean Squared Error or Cross-Entropy, quantify the error of the model, guiding the optimization process to minimize these errors and improve predictive accuracy.
Principal Component Analysis (PCA)
PCA is a powerful dimensionality reduction technique. It transforms a dataset with many variables into a smaller set of uncorrelated components, capturing most of the variance. This is crucial for simplifying complex datasets, improving model performance, and enabling visualization of high-dimensional data.
Architecting a Data Science Career
For those aspiring to be Data Scientists, the path is rigorous but rewarding. It involves continuous learning, hands-on practice, and a keen analytical mind. Many find structured learning programs to be invaluable:
"The ability to take data—to be able to drive decisions with it—is still the skill that’s going to make you stand out. That’s the most important business skill you can have." - Jeff Bezos
Programs offering comprehensive training, including theoretical knowledge, practical case studies, and extensive hands-on projects, provide a significant advantage. Look for curricula that cover Python, R, Machine Learning, and essential statistical concepts. Industry-recognized certifications from reputable institutions can also bolster your credentials and attract potential employers. Such programs often include mentorship, access to advanced lab environments, and even job placement assistance, accelerating your transition into the field.
The Practitioner's Edge: Tools and Certifications
To elevate your skills from novice to operative, consider a structured approach. Post-graduate programs in Data Science, often in collaboration with leading universities and tech giants like IBM, offer deep dives into both theoretical frameworks and practical implementation. These programs are designed to provide:
- Access to industry-recognized certificates.
- Extensive hands-on projects in advanced, lab environments.
- Applied learning hours that build real-world competency.
- Capstone projects allowing specialization in chosen domains.
- Networking opportunities and potential career support.
Investing in specialized training and certifications is not merely about acquiring credentials; it's about building a robust skill set that aligns with market demands and preparing for the complex analytical challenges ahead. For those serious about making an impact, exploring programs like the Simplilearn Post Graduate Program in Data Science, ranked highly by industry publications, is a logical step.
Arsenal of the Data Operator
- Primary IDE: Jupyter Notebook/Lab, VS Code (with Python extensions)
- Core Libraries: NumPy, Pandas, Matplotlib, Seaborn, Scikit-learn
- Advanced Analytics: TensorFlow, PyTorch (for deep learning)
- Cloud Platforms: AWS SageMaker, Google AI Platform, Azure ML Studio
- Version Control: Git, GitHub/GitLab
- Learning Resources: "Python for Data Analysis" by Wes McKinney, Coursera/edX Data Science Specializations.
- Certifications: Consider certifications from providers with strong industry partnerships, such as those offered in conjunction with Purdue University or IBM.
Taller Práctico: Fortaleciendo tu Pipeline de Análisis
-
Setup: Ensure you have Python installed. Set up a virtual environment using `venv` for project isolation.
python -m venv ds_env source ds_env/bin/activate # On Windows: ds_env\Scripts\activate -
Install Core Libraries: Use pip to install NumPy, Pandas, and Matplotlib.
pip install numpy pandas matplotlib -
Load and Inspect Data: Create a sample CSV file or download one. Use Pandas to load and perform initial inspection.
import pandas as pd # Assuming 'data.csv' exists in the same directory try: df = pd.read_csv('data.csv') print("Data loaded successfully. First 5 rows:") print(df.head()) print("\nBasic info:") df.info() except FileNotFoundError: print("Error: data.csv not found. Please ensure the file is in the correct directory.") -
Basic Visualization: Generate a simple plot to understand a key feature.
import matplotlib.pyplot as plt

# Example: Plotting a column named 'value'
if 'value' in df.columns:
    plt.figure(figsize=(10, 6))
    plt.hist(df['value'].dropna(), bins=20, edgecolor='black')
    plt.title('Distribution of Values')
    plt.xlabel('Value')
    plt.ylabel('Frequency')
    plt.grid(axis='y', alpha=0.75)
    plt.show()
else:
    print("Column 'value' not found for plotting.")
Preguntas Frecuentes
-
¿Necesito ser un experto en matemáticas para aprender Data Science con Python?
Si bien una base sólida en matemáticas y estadística es beneficiosa, no es un requisito de entrada absoluto. Muchos recursos de aprendizaje, como el cubierto aquí, integran estos conceptos de manera progresiva a medida que se aplican en Python.
-
¿Cuánto tiempo se tarda en dominar Python para Data Science?
El dominio es un viaje continuo. Sin embargo, con dedicación y práctica constante durante varios meses, un individuo puede volverse competente en las bibliotecas centrales y los flujos de trabajo de análisis básicos.
-
¿Es Python la única opción para Data Science?
Python es actualmente el lenguaje más popular, pero otros lenguajes como R, Scala y Julia también se utilizan ampliamente en el campo de la ciencia de datos y el aprendizaje automático.
"The data is the new oil. But unlike oil, data is reusable and the value increases over time." - Arend Hintze
El Contrato: Tu Primer Análisis de Datos Real
Has absorbido los fundamentos: las bibliotecas, las matemáticas, los algoritmos. Ahora es el momento de ponerlo a prueba. Tu desafío es el siguiente: consigue un dataset público (Kaggle es un buen punto de partida). Realiza un análisis exploratorio básico utilizando Pandas. Identifica al menos dos variables interesantes, genera una visualización simple para cada una con Matplotlib, y documenta tus hallazgos iniciales en un breve informe de 200 palabras. Comparte el enlace a tu repositorio si lo publicas en GitHub o describe tu proceso en los comentarios. Demuestra que puedes pasar de la teoría a la práctica.
Para más información sobre cursos avanzados y programas de certificación en Ciencia de Datos, explora recursos en Simplilearn.
Este contenido se presenta con fines educativos y de desarrollo profesional. Las referencias a programas de certificación y cursos específicos son para ilustrar el camino hacia la profesionalización en Ciencia de Datos.
Visita Sectemple para más análisis de seguridad, hacking ético y ciencia de datos.
Explora otros enfoques en mis blogs: El Antroposofista, Gaming Speedrun, Skate Mutante, Budoy Artes Marciales, El Rincón Paranormal, Freak TV Series.
Adquiere NFTs únicos a bajo precio en mintable.app/u/cha0smagick.