STRATEGY INDEX
- Mission Briefing: What is Statistics?
- Phase 1: Intelligence Gathering - Sampling Techniques
- Phase 2: Operational Planning - Experimental Design
- Phase 3: Counter-Intelligence - Randomization Protocols
- Phase 4: Data Visualization - Frequency Histograms and Distributions
- Phase 5: Visual Reconnaissance - Time Series, Bar, and Pie Graphs
- Phase 6: Data Structuring - Frequency Tables and Stem-and-Leaf Plots
- Phase 7: Core Metrics - Measures of Central Tendency
- Phase 8: Dispersion Analysis - Measures of Variation
- Phase 9: Distribution Mapping - Percentiles and Box-and-Whisker Plots
- Phase 10: Correlation Analysis - Scatter Diagrams and Linear Correlation
- Phase 11: Predictive Modeling - Normal Distribution and the Empirical Rule
- Phase 12: Probability Calculus - Z-Scores and Probabilities
- Phase 13: Advanced Inference - Sampling Distributions and the Central Limit Theorem
- The Engineer's Arsenal: Essential Tools and Resources
- Engineer's Verdict: The Value of Statistical Mastery
- Frequently Asked Questions (FAQ)
- About The Cha0smagick
Mission Briefing: What is Statistics?
Welcome, operative. In the shadowy world of digital intelligence and technological advancement, data is the ultimate currency. But raw data is chaotic, a digital fog obscuring the truth. Statistics is your decryption key, the rigorous discipline that transforms noisy datasets into actionable intelligence. This isn't just about crunching numbers; it's about understanding the underlying patterns, making informed predictions, and drawing meaningful conclusions from complex information. In this comprehensive university-level course, we will dissect the methodologies used to collect, organize, summarize, interpret, and ultimately, reach definitive conclusions about data. Prepare to move beyond mere mathematical calculations and embrace statistics as the analytical powerhouse it is.
This intelligence dossier is meticulously compiled based on the principles laid out in "Understanding Basic Statistics, 6th Edition" by Brase & Brase. For those seeking deeper foundational knowledge, the full textbook is available here. Our primary instructor for this mission is the highly experienced Monika Wahi, whose expertise has shaped this curriculum.
Phase 1: Intelligence Gathering - Sampling Techniques
Before any operation commences, accurate intelligence is paramount. In statistics, this translates to sampling. We can't analyze every single bit of data in the universe – it's computationally infeasible and often unnecessary. Sampling involves selecting a representative subset of data from a larger population. This phase focuses on understanding various sampling methods, from simple random sampling to stratified and cluster sampling. The goal is to ensure the sample accurately reflects the characteristics of the population, minimizing bias and maximizing the reliability of our subsequent analyses. Understanding the nuances of sampling is critical for drawing valid generalizations and preventing flawed conclusions.
Phase 2: Operational Planning - Experimental Design
Statistical analysis is only as good as the data it's fed. This is where experimental design comes into play. It's the blueprint for how data is collected in a controlled environment to answer specific research questions. We'll explore different experimental structures, including observational studies versus controlled experiments, the concept of treatments, subjects, and response variables. Proper experimental design minimizes confounding factors and ensures that observed effects can be confidently attributed to the variables under investigation. This phase is crucial for setting up data collection processes that yield meaningful and statistically sound results.
Phase 3: Counter-Intelligence - Randomization Protocols
Bias is the enemy of accurate analysis. Randomization is one of our most potent weapons against it. In this section, we delve into the principles and application of random assignment in experiments and random selection in sampling. By introducing randomness, we ensure that potential lurking variables are distributed evenly across different groups or samples, preventing systematic errors. This helps to isolate the effect of the variable being tested and strengthens the validity of our findings. Mastering randomization is key to building robust statistical models that can withstand scrutiny.
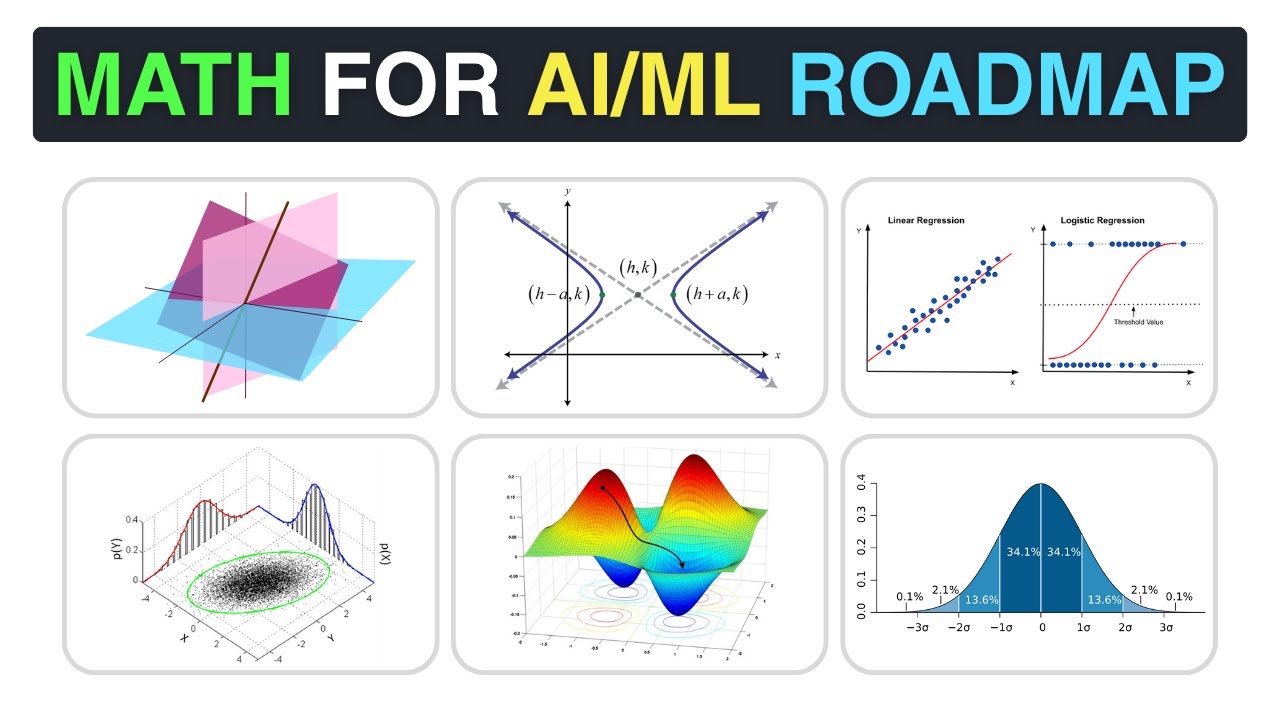
Phase 4: Data Visualization - Frequency Histograms and Distributions
Raw numbers can be overwhelming. Visual representation is essential for understanding data patterns. A frequency histogram is a powerful tool for visualizing the distribution of continuous numerical data. We'll learn how to construct histograms, interpret their shapes (e.g., symmetric, skewed, bimodal), and understand what they reveal about the underlying data distribution. This visual analysis is often the first step in exploratory data analysis (EDA) and provides crucial insights into the data's characteristics.
Phase 5: Visual Reconnaissance - Time Series, Bar, and Pie Graphs
Different types of data demand different visualization techniques. This phase expands our visual toolkit:
- Time Series Graphs: Essential for tracking data trends over time, invaluable in fields like finance, economics, and IoT analytics.
- Bar Graphs: Perfect for comparing categorical data across different groups or items.
- Pie Graphs: Useful for illustrating proportions and percentages within a whole, best used for a limited number of categories.
Mastering these graphical representations allows us to communicate complex data narratives effectively and identify patterns that might otherwise remain hidden.
Phase 6: Data Structuring - Frequency Tables and Stem-and-Leaf Plots
Before visualization, data often needs structuring. We explore two fundamental methods:
- Frequency Tables: Organize data by showing the frequency (count) of each distinct value or range of values. This is a foundational step for understanding data distribution.
- Stem-and-Leaf Plots: A simple graphical method that displays all the individual data values while also giving a sense of the overall distribution. It retains the actual data points, offering a unique blend of summary and detail.
Phase 7: Core Metrics - Measures of Central Tendency
To summarize a dataset, we need measures that represent its center. This section covers the primary measures of central tendency:
- Mean: The arithmetic average.
- Median: The middle value in an ordered dataset.
- Mode: The most frequently occurring value.
We will analyze when to use each measure, considering their sensitivity to outliers and their suitability for different data types. Understanding central tendency is fundamental to summarizing and describing datasets.
Phase 8: Dispersion Analysis - Measures of Variation
Knowing the center of the data is only part of the story. The measure of variation tells us how spread out the data points are. Key metrics include:
- Range: The difference between the maximum and minimum values.
- Interquartile Range (IQR): The range of the middle 50% of the data.
- Variance: The average of the squared differences from the Mean.
- Standard Deviation: The square root of the variance, providing a measure of spread in the original units of the data.
Understanding variation is critical for assessing risk, predictability, and the overall consistency of data.
Phase 9: Distribution Mapping - Percentiles and Box-and-Whisker Plots
To further refine our understanding of data distribution, we examine percentiles and box-and-whisker plots.
- Percentiles: Indicate the value below which a given percentage of observations fall. Quartiles (25th, 50th, 75th percentiles) are particularly important.
- Box-and-Whisker Plots (Box Plots): A standardized way of displaying the distribution of data based on a five-number summary: minimum, first quartile (Q1), median, third quartile (Q3), and maximum. They are excellent for comparing distributions across different groups and identifying potential outliers.
Phase 10: Correlation Analysis - Scatter Diagrams and Linear Correlation
In many real-world scenarios, variables are not independent; they influence each other. Scatter diagrams provide a visual representation of the relationship between two numerical variables. We will analyze these plots to identify patterns such as positive, negative, or no correlation. Furthermore, we'll quantify this relationship using the linear correlation coefficient (r), understanding its properties and interpretation. This phase is foundational for predictive modeling and understanding causal links.
Phase 11: Predictive Modeling - Normal Distribution and the Empirical Rule
The Normal Distribution, often called the bell curve, is arguably the most important distribution in statistics. Many natural phenomena and datasets approximate this distribution. We will study its properties, including its symmetry and the role of the mean and standard deviation. The Empirical Rule (or 68-95-99.7 rule) provides a quick way to estimate the proportion of data falling within certain standard deviations from the mean in a normal distribution, a key concept for making predictions and assessing probabilities.
Phase 12: Probability Calculus - Z-Scores and Probabilities
To work with probabilities, especially concerning the normal distribution, we introduce the Z-score. A Z-score measures how many standard deviations an observation is away from the mean. It standardizes data, allowing us to compare values from different distributions and calculate probabilities using standard normal distribution tables or software. This is a critical skill for hypothesis testing and inferential statistics.
Phase 13: Advanced Inference - Sampling Distributions and the Central Limit Theorem
This is where we bridge descriptive statistics to inferential statistics. A sampling distribution describes the distribution of a statistic (like the sample mean) calculated from multiple random samples drawn from the same population. The Central Limit Theorem (CLT) is a cornerstone of inferential statistics, stating that the sampling distribution of the mean will approach a normal distribution as the sample size increases, regardless of the population's original distribution. This theorem underpins much of our ability to make inferences about a population based on a single sample.
The Engineer's Arsenal: Essential Tools and Resources
To truly master statistics and data science, you need the right tools. Here’s a curated list for your operational toolkit:
- Textbook: "Understanding Basic Statistics" by Brase & Brase (6th Edition) – The foundational text for this course.
- Online Learning Platform: Scrimba – Offers interactive coding courses perfect for practical application.
- Instructor's Resources: Explore Monika Wahi's LinkedIn Learning courses and her web page for supplementary materials.
- Academic Research: Monika Wahi's peer-reviewed articles offer deeper insights.
- Core Concepts: freeCodeCamp.org provides extensive articles and tutorials on programming and data science principles.
- Programming Languages: Proficiency in Python (with libraries like NumPy, Pandas, SciPy, Matplotlib, Seaborn) and/or R is essential for practical statistical analysis.
- Statistical Software: Familiarity with packages like SAS, SPSS, or even advanced use of Excel's data analysis tools is beneficial.
- Cloud Platforms: For large-scale data operations, understanding AWS, Azure, or GCP services related to data analytics and storage is increasingly critical.
Engineer's Verdict: The Value of Statistical Mastery
In the rapidly evolving landscape of technology and business, the ability to interpret and leverage data is no longer a niche skill; it's a fundamental requirement. Statistics provides the bedrock upon which data science, machine learning, and informed decision-making are built. Whether you're developing algorithms, auditing cloud infrastructure, designing secure networks, or analyzing user behavior on a SaaS platform, a solid grasp of statistical principles empowers you to move beyond intuition and operate with precision. This course equips you with the analytical rigor to uncover hidden correlations, predict future trends, and extract maximum value from the data streams you encounter. It’s a critical component of any high-performance digital operative's skillset.
Frequently Asked Questions (FAQ)
Q1: Is this course suitable for absolute beginners with no prior math background?
A1: This course covers university-level basics. While it aims to explain concepts intuitively using real-life examples rather than just abstract math, a foundational understanding of basic algebra is recommended. The focus is on application and interpretation.
Q2: How much programming is involved in this statistics course?
A2: This specific course focuses on the statistical concepts themselves, drawing from a textbook. While programming (like Python or R) is essential for *applying* these statistical methods in data science, the lectures themselves are conceptual. You'll learn the 'what' and 'why' here, which you'll then implement using code in a separate programming-focused course or tutorial.
Q3: How long will it take to complete this course?
A3: The video content itself is approximately 7 hours and 45 minutes. However, true mastery requires practice. Allocate additional time for reviewing concepts, working through examples, and potentially completing exercises or projects related to each topic.
Q4: What are the key takeaways for someone interested in Data Science careers?
A4: You will gain a solid understanding of data collection, summarization, visualization, probability, and the foundational concepts (like sampling distributions and the CLT) that underpin inferential statistics and machine learning modeling.
About The Cha0smagick
The Cha0smagick is a seasoned digital operative, a polymath engineer, and an ethical hacker with deep roots in the trenches of cybersecurity and data architecture. Renowned for dissecting complex systems and forging actionable intelligence from raw data, The Cha0smagick operates Sectemple as a secure archive of critical knowledge for the elite digital community. Each dossier is meticulously crafted not just to inform, but to empower operatives with the skills and understanding needed to navigate and dominate the digital frontier.
Your Mission: Execute, Share, and Debate
If this blueprint has streamlined your understanding of statistical fundamentals and armed you with actionable insights, disseminate this intelligence. Share it across your professional networks – knowledge is a tool, and this is a critical upgrade.
Encountering a peer struggling with data interpretation? Tag them. A true operative ensures their unit is prepared.
What statistical enigma or data science challenge should be the subject of our next deep-dive analysis? Drop your suggestions in the debriefing section below. Your input directly shapes our future operational directives.
Debriefing of the Mission
Leave your analysis, questions, and tactical feedback in the comments. This is your debriefing, operative. The floor is yours.